
- Start >
- Rivers >
- Discharge >
- Oberer Main - Elbe >
- Laufermühle >
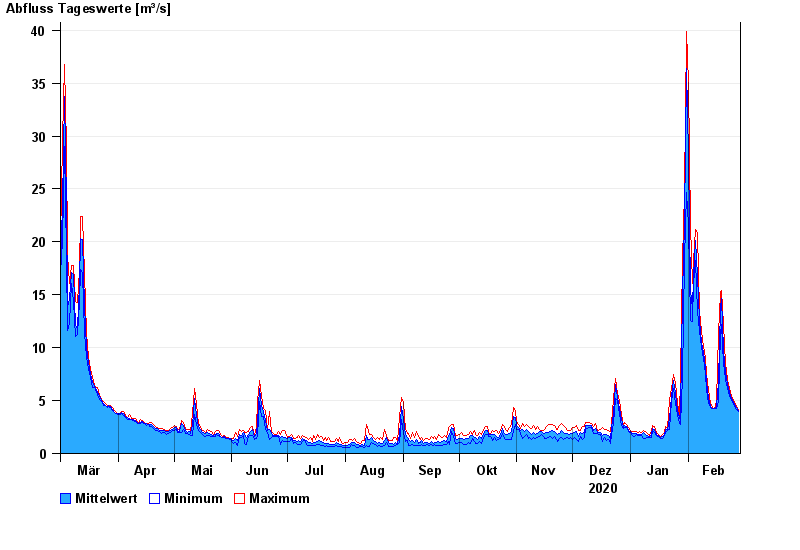
- Chart of year

Chart of year Laufermühle / Aisch
Discharge from 01.03.2020 to 28.02.2021
| Date | Mean value [m³/s] | Maximum [m³/s] | Minimum [m³/s] |
|---|---|---|---|
| 28.02.2021 | 4.07 | 4.18 | 3.99 |
| 27.02.2021 | 4.31 | 4.43 | 4.18 |
| 26.02.2021 | 4.64 | 4.81 | 4.43 |
| 25.02.2021 | 4.9 | 5 | 4.74 |
| 24.02.2021 | 5.18 | 5.39 | 4.99 |
| 23.02.2021 | 5.76 | 6.13 | 5.38 |
| 22.02.2021 | 6.54 | 7.03 | 6.12 |
© Bayerisches Landesamt für Umwelt 2024