
- Start >
- Rivers >
- Discharge >
- Oberer Main - Elbe >
- Laufermühle >
- Chart of year

Chart of year Laufermühle / Aisch
Discharge from 01.01.2020 to 31.12.2020
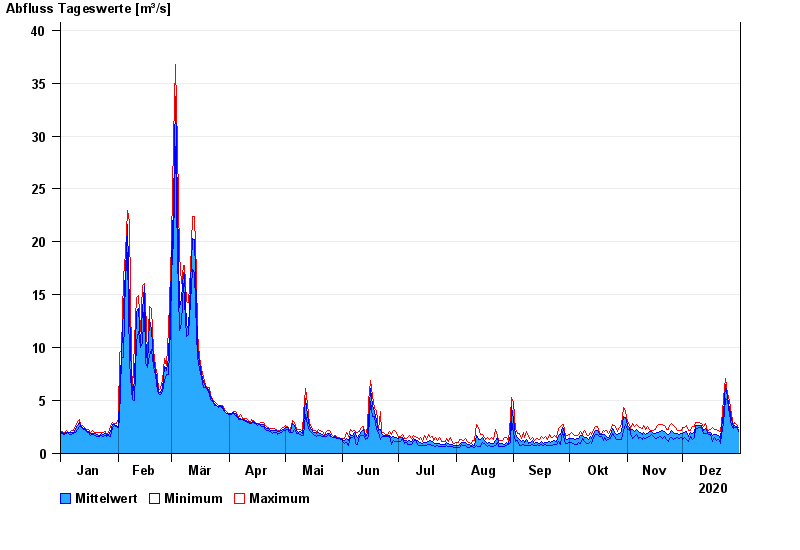
| Date | Mean value [m³/s] | Maximum [m³/s] | Minimum [m³/s] |
|---|---|---|---|
| 31.12.2020 | 2.21 | 2.43 | 2.08 |
| 30.12.2020 | 2.52 | 2.74 | 2.43 |
| 29.12.2020 | 2.65 | 2.93 | 2.46 |
| 28.12.2020 | 2.47 | 2.6 | 2.36 |
| 27.12.2020 | 3.22 | 3.73 | 2.6 |
| 26.12.2020 | 4.28 | 4.99 | 3.73 |
| 25.12.2020 | 5.29 | 5.67 | 4.99 |
© Bayerisches Landesamt für Umwelt 2024