
- Start >
- Rivers >
- Discharge >
- Oberer Main - Elbe >
- Laufermühle >
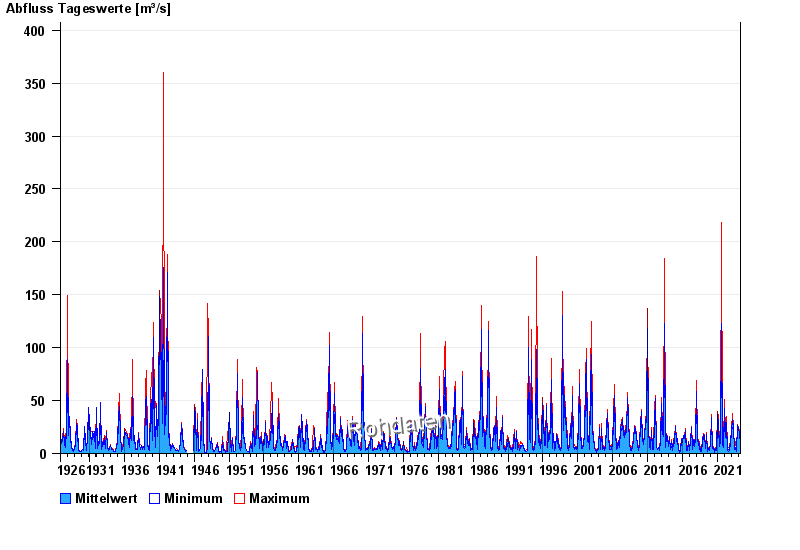
- Chart of total period

Chart of total period Laufermühle / Aisch
Discharge from 01.11.1926 to 23.04.2024
| Date | Mean value [m³/s] | Maximum [m³/s] | Minimum [m³/s] |
|---|---|---|---|
| 23.04.2024 | 7.49 | 7.86 | 7.06 |
| 22.04.2024 | 9.17 | 9.83 | 7.86 |
| 21.04.2024 | 6.86 | 8.16 | 6.02 |
| 20.04.2024 | 6.32 | 7.28 | 4.82 |
| 19.04.2024 | 4.15 | 4.82 | 3.72 |
| 18.04.2024 | 4.43 | 4.88 | 3.91 |
| 17.04.2024 | 4.65 | 5.15 | 4.11 |
© Bayerisches Landesamt für Umwelt 2024