
- Start >
- Rivers >
- Discharge >
- Oberer Main - Elbe >
- Langenau >
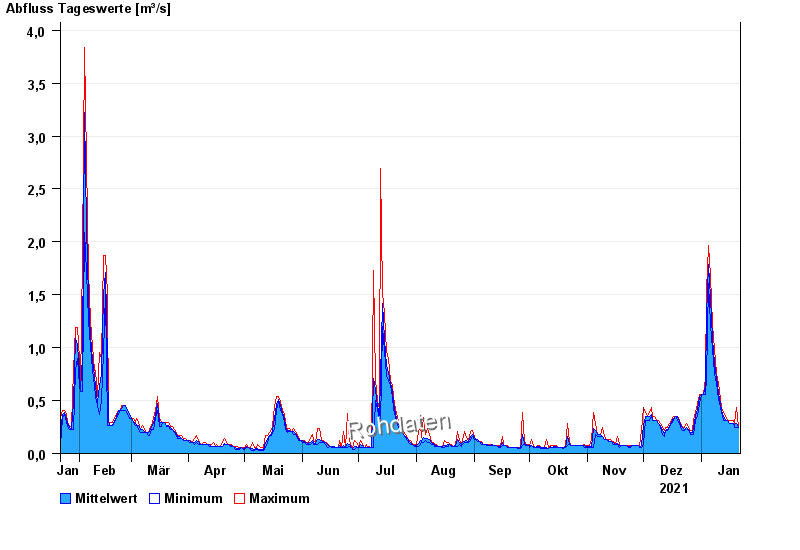
- Chart of year

Chart of year Langenau / Langenaubach
Discharge from 22.01.2021 to 21.01.2022
| Date | Mean value [m³/s] | Maximum [m³/s] | Minimum [m³/s] |
|---|---|---|---|
| 21.01.2022 | 0.246 | 0.246 | 0.246 |
| 20.01.2022 | 0.284 | 0.431 | 0.246 |
| 19.01.2022 | 0.278 | 0.279 | 0.246 |
| 18.01.2022 | 0.281 | 0.314 | 0.279 |
| 17.01.2022 | 0.285 | 0.314 | 0.279 |
| 16.01.2022 | 0.288 | 0.314 | 0.279 |
| 15.01.2022 | 0.314 | 0.314 | 0.314 |
© Bayerisches Landesamt für Umwelt 2024