
- Start >
- Rivers >
- Discharge >
- Oberer Main - Elbe >
- Langenau >
- Chart of total period

Chart of total period Langenau / Langenaubach
Discharge from 01.11.1964 to 25.04.2024
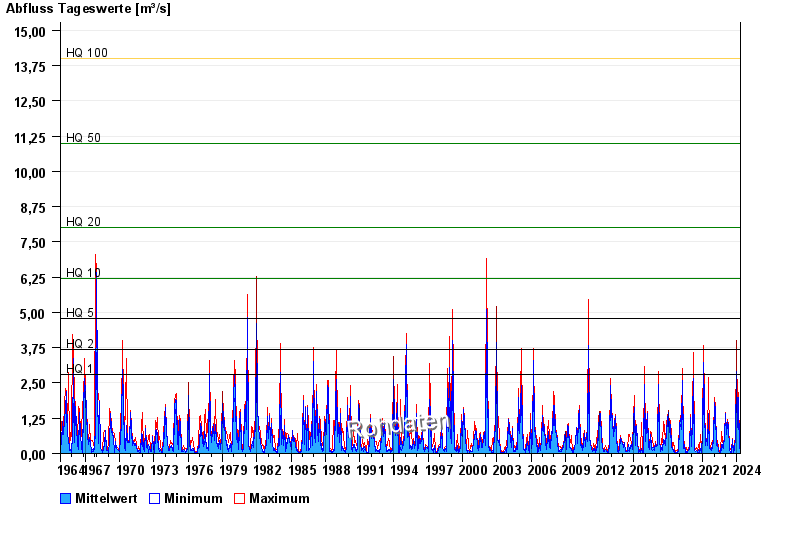
- HQ1 2,8 m³/s
- HQ2 3,7 m³/s
- HQ5 4,8 m³/s
- HQ10 6,2 m³/s
- HQ20 8 m³/s
- HQ50 11 m³/s
- HQ100 14 m³/s
| Date | Mean value [m³/s] | Maximum [m³/s] | Minimum [m³/s] |
|---|---|---|---|
| 25.04.2024 | 0.325 | 0.326 | 0.289 |
| 24.04.2024 | 0.343 | 0.363 | 0.326 |
| 23.04.2024 | 0.363 | 0.363 | 0.363 |
| 22.04.2024 | 0.341 | 0.363 | 0.326 |
| 21.04.2024 | 0.295 | 0.326 | 0.251 |
| 20.04.2024 | 0.22 | 0.251 | 0.164 |
| 19.04.2024 | 0.119 | 0.19 | 0.079 |
© Bayerisches Landesamt für Umwelt 2024