
- Start >
- Rivers >
- Discharge >
- Oberer Main - Elbe >
- Kautendorf >
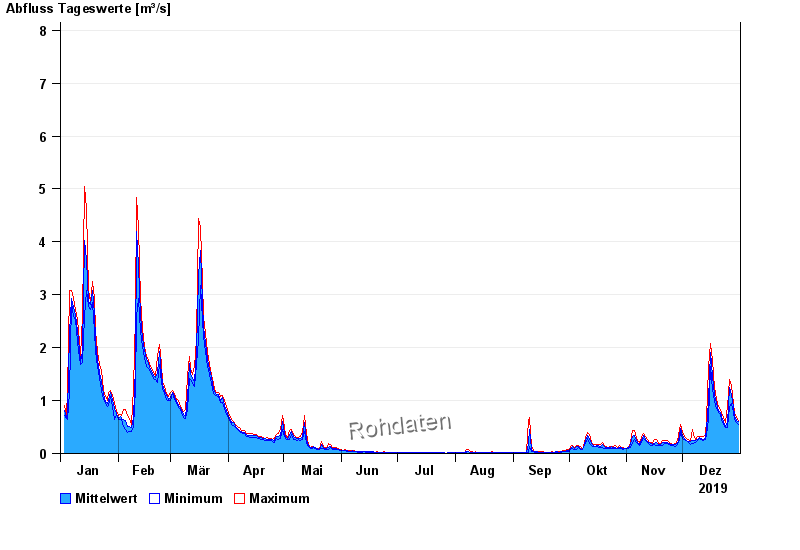
- Chart of year

Chart of year Kautendorf / Südliche Regnitz
Discharge from 01.01.2019 to 31.12.2019
note
- 02.06.2013 Abfluss: 40,9 m³/s
- 24.07.2010 Abfluss: 25,1 m³/s
- 14.01.2011 Abfluss: 24,1 m³/s
- 27.03.2006 Abfluss: 20 m³/s
- 24.12.2012 Abfluss: 19,3 m³/s
| Date | Mean value [m³/s] | Maximum [m³/s] | Minimum [m³/s] |
|---|---|---|---|
| 31.12.2019 | 0.597 | 0.617 | 0.554 |
| 30.12.2019 | 0.633 | 0.68 | 0.586 |
| 29.12.2019 | 0.718 | 0.776 | 0.649 |
| 28.12.2019 | 0.89 | 0.952 | 0.776 |
| 27.12.2019 | 1.09 | 1.28 | 0.952 |
| 26.12.2019 | 1.24 | 1.4 | 0.882 |
| 25.12.2019 | 0.588 | 0.882 | 0.491 |
© Bayerisches Landesamt für Umwelt 2024