
- Start >
- Rivers >
- Discharge >
- Oberer Main - Elbe >
- Kautendorf >
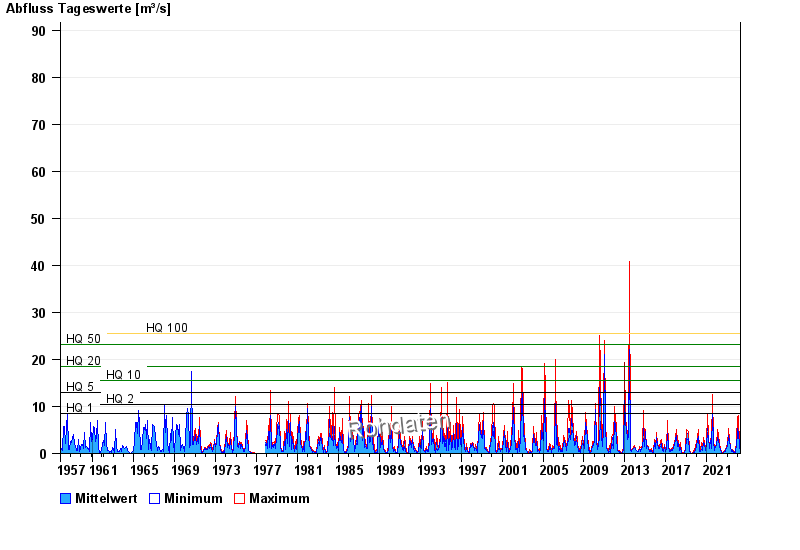
- Chart of total period

Chart of total period Kautendorf / Südliche Regnitz
Discharge from 01.11.1957 to 20.04.2024
note
- HQ1 8,4 m³/s
- HQ2 10,5 m³/s
- HQ5 12,9 m³/s
- HQ10 15,6 m³/s
- HQ20 18,6 m³/s
- HQ50 23,2 m³/s
- HQ100 25,5 m³/s
| Date | Mean value [m³/s] | Maximum [m³/s] | Minimum [m³/s] |
|---|---|---|---|
| 20.04.2024 | 0.419 | 0.513 | 0.355 |
| 19.04.2024 | 0.352 | 0.381 | 0.331 |
| 18.04.2024 | 0.431 | 0.486 | 0.381 |
| 17.04.2024 | 0.417 | 0.513 | 0.307 |
| 16.04.2024 | 0.256 | 0.307 | 0.235 |
| 15.04.2024 | 0.237 | 0.258 | 0.235 |
| 14.04.2024 | 0.247 | 0.258 | 0.235 |
© Bayerisches Landesamt für Umwelt 2024