
- Start >
- Rivers >
- Discharge >
- Oberer Main - Elbe >
- Hohenberg >
- Chart of year

Chart of year Hohenberg / Eger
Discharge from 03.06.2023 to 02.06.2024
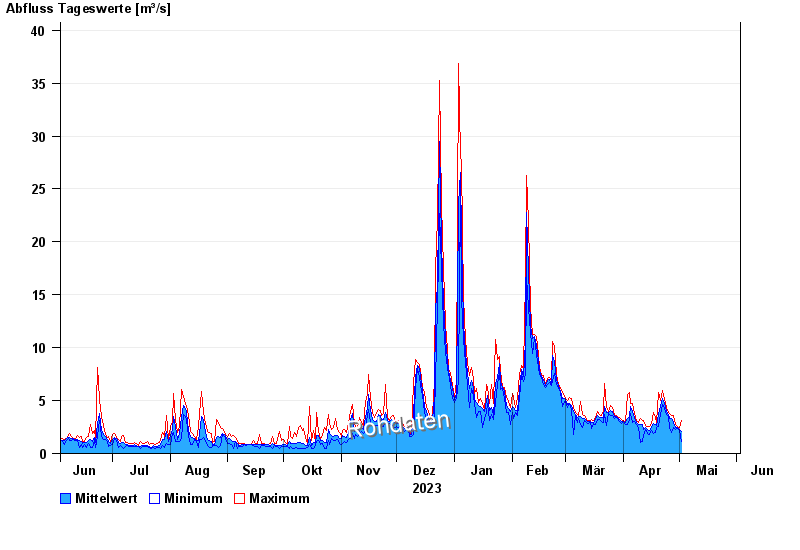
| Date | Mean value [m³/s] | Maximum [m³/s] | Minimum [m³/s] |
|---|---|---|---|
| 19.04.2024 | 2.74 | 2.94 | 2.5 |
| 18.04.2024 | 2.71 | 3.41 | 2.02 |
| 17.04.2024 | 2.86 | 3.91 | 1.87 |
| 16.04.2024 | 2.46 | 2.85 | 2.18 |
| 15.04.2024 | 2.13 | 2.59 | 1.8 |
| 14.04.2024 | 2.26 | 2.59 | 1.87 |
| 13.04.2024 | 2.41 | 2.68 | 2.26 |
© Bayerisches Landesamt für Umwelt 2024