
- Start >
- Rivers >
- Discharge >
- Oberer Main - Elbe >
- Hohenberg >
- Chart of year

Chart of year Hohenberg / Eger
Discharge from 01.01.2024 to 18.04.2024
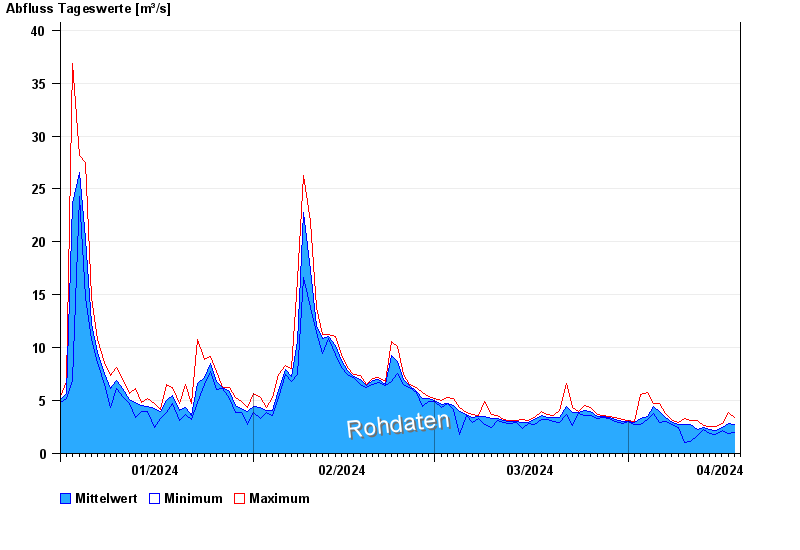
| Date | Mean value [m³/s] | Maximum [m³/s] | Minimum [m³/s] |
|---|---|---|---|
| 18.04.2024 | 2.77 | 3.49 | 2.09 |
| 17.04.2024 | 2.93 | 3.99 | 1.93 |
| 16.04.2024 | 2.52 | 2.93 | 2.25 |
| 15.04.2024 | 2.2 | 2.67 | 1.86 |
| 14.04.2024 | 2.33 | 2.67 | 1.86 |
| 13.04.2024 | 2.46 | 2.75 | 2.33 |
| 12.04.2024 | 2.36 | 3.49 | 1.65 |
© Bayerisches Landesamt für Umwelt 2024