
- Start >
- Rivers >
- Discharge >
- Oberer Main - Elbe >
- Heinersdorf >
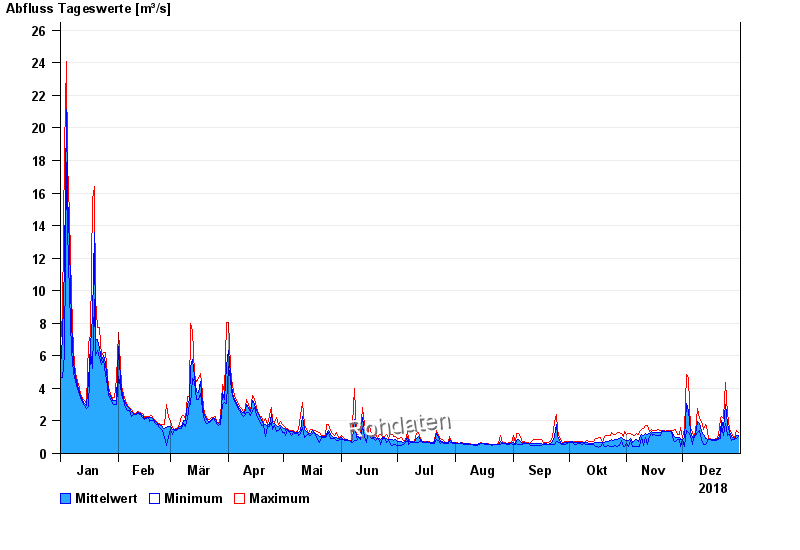
- Chart of year

Chart of year Heinersdorf / Rodach
Discharge from 01.01.2018 to 31.12.2018
| Date | Mean value [m³/s] | Maximum [m³/s] | Minimum [m³/s] |
|---|---|---|---|
| 31.12.2018 | 1.13 | 1.29 | 1.02 |
| 30.12.2018 | 1.12 | 1.43 | 0.904 |
| 29.12.2018 | 0.909 | 0.984 | 0.864 |
| 28.12.2018 | 0.986 | 1.07 | 0.864 |
| 27.12.2018 | 1.04 | 1.2 | 0.825 |
| 26.12.2018 | 1.3 | 1.48 | 1.15 |
| 25.12.2018 | 1.82 | 2.45 | 1.11 |
© Bayerisches Landesamt für Umwelt 2024