
- Start >
- Rivers >
- Discharge >
- Oberer Main - Elbe >
- Heinersdorf >
- Chart of year

Chart of year Heinersdorf / Rodach
Discharge from 01.01.2019 to 31.12.2019
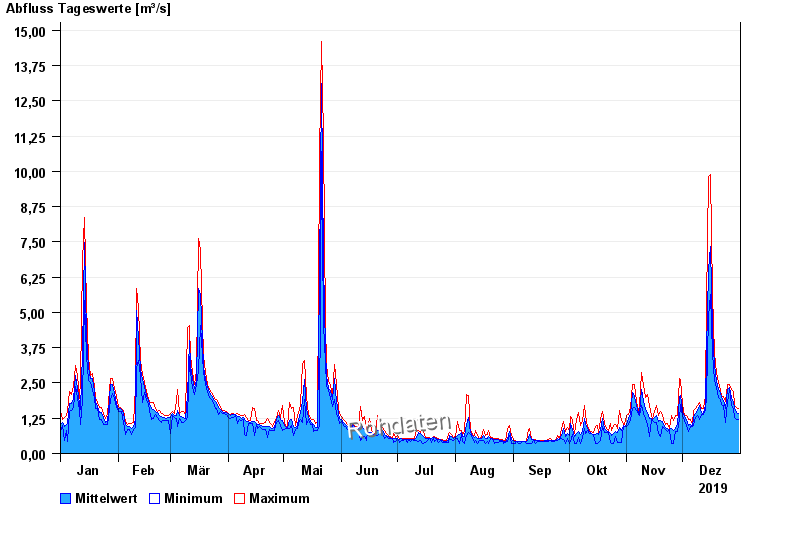
| Date | Mean value [m³/s] | Maximum [m³/s] | Minimum [m³/s] |
|---|---|---|---|
| 31.12.2019 | 1.41 | 1.59 | 1.2 |
| 30.12.2019 | 1.46 | 1.64 | 1.2 |
| 29.12.2019 | 1.62 | 1.69 | 1.29 |
| 28.12.2019 | 1.81 | 2.21 | 1.59 |
| 27.12.2019 | 2 | 2.27 | 1.69 |
| 26.12.2019 | 2.35 | 2.46 | 2.27 |
| 25.12.2019 | 2.26 | 2.46 | 1.8 |
© Bayerisches Landesamt für Umwelt 2024