
- Start >
- Rivers >
- Discharge >
- Oberer Main - Elbe >
- Heinersdorf >
- Chart of year

Chart of year Heinersdorf / Rodach
Discharge from 01.01.2024 to 20.04.2024
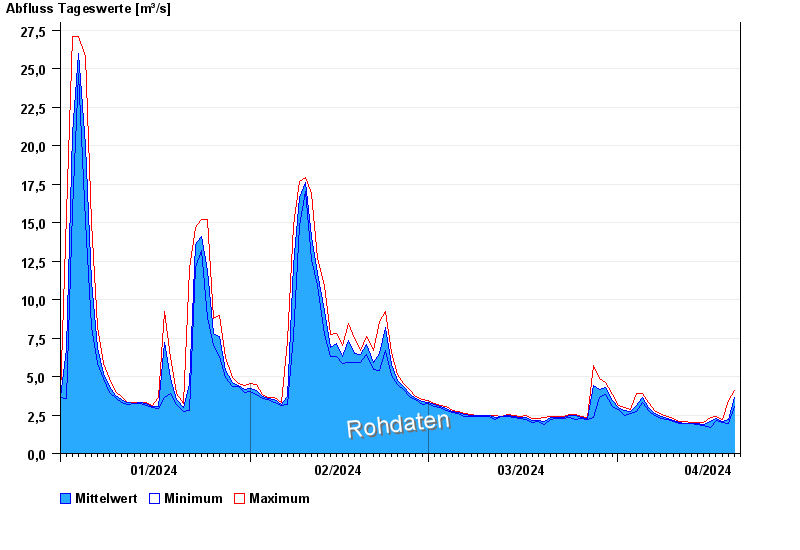
| Date | Mean value [m³/s] | Maximum [m³/s] | Minimum [m³/s] |
|---|---|---|---|
| 20.04.2024 | 3.9 | 4.11 | 3.54 |
| 19.04.2024 | 2.2 | 3.47 | 1.93 |
| 18.04.2024 | 2.06 | 2.22 | 1.99 |
| 17.04.2024 | 2.29 | 2.41 | 2.16 |
| 16.04.2024 | 2.05 | 2.34 | 1.71 |
| 15.04.2024 | 1.9 | 1.99 | 1.82 |
| 14.04.2024 | 1.93 | 1.99 | 1.87 |
© Bayerisches Landesamt für Umwelt 2024