
- Start >
- Rivers >
- Discharge >
- Oberer Main - Elbe >
- Hammerles >
- Chart of total period

Chart of total period Hammerles / Schweinnaab
Discharge from 17.05.2009 to 19.04.2024
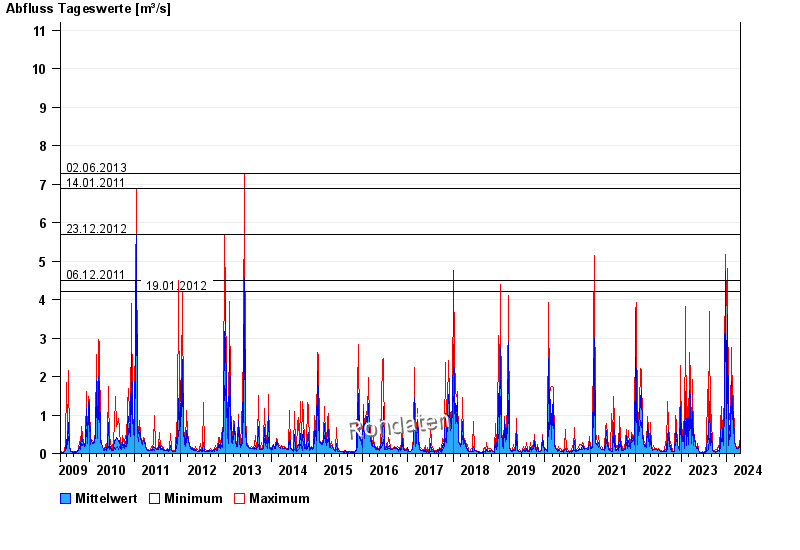
- 02.06.2013 Abfluss: 7,27 m³/s
- 14.01.2011 Abfluss: 6,88 m³/s
- 23.12.2012 Abfluss: 5,69 m³/s
- 06.12.2011 Abfluss: 4,5 m³/s
- 19.01.2012 Abfluss: 4,22 m³/s
| Date | Mean value [m³/s] | Maximum [m³/s] | Minimum [m³/s] |
|---|---|---|---|
| 19.04.2024 | 0.211 | 0.243 | 0.208 |
| 18.04.2024 | 0.22 | 0.225 | 0.208 |
| 17.04.2024 | 0.248 | 0.284 | 0.225 |
| 16.04.2024 | 0.228 | 0.403 | 0.177 |
| 15.04.2024 | 0.173 | 0.191 | 0.163 |
| 14.04.2024 | 0.158 | 0.163 | 0.139 |
| 13.04.2024 | 0.13 | 0.151 | 0.118 |
© Bayerisches Landesamt für Umwelt 2024