
- Start >
- Rivers >
- Discharge >
- Oberer Main - Elbe >
- Hallerndorf >
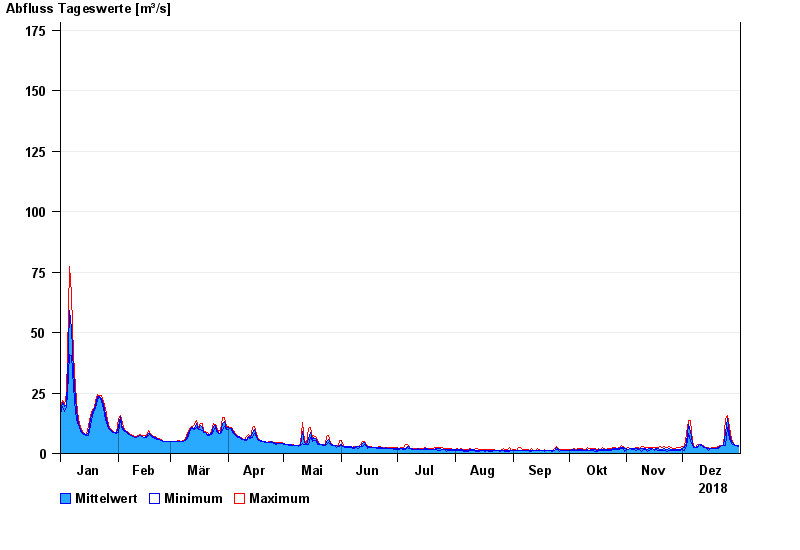
- Chart of year

Chart of year Hallerndorf / Aisch
Discharge from 01.01.2018 to 31.12.2018
 Für diesen Pegel sind keine Jährlichkeiten hinterlegt.
| Date | Mean value [m³/s] | Maximum [m³/s] | Minimum [m³/s] |
|---|---|---|---|
| 31.12.2018 | 3.3 | 3.36 | 2.9 |
| 30.12.2018 | 3.29 | 3.36 | 3.24 |
| 29.12.2018 | 3.57 | 3.86 | 3.36 |
| 28.12.2018 | 4.08 | 4.25 | 3.86 |
| 27.12.2018 | 4.9 | 5.82 | 4.12 |
| 26.12.2018 | 7.65 | 10.9 | 5.82 |
| 25.12.2018 | 14.5 | 15.6 | 10.9 |
© Bayerisches Landesamt für Umwelt 2024