
- Start >
- Rivers >
- Discharge >
- Oberer Main - Elbe >
- Hallerndorf >
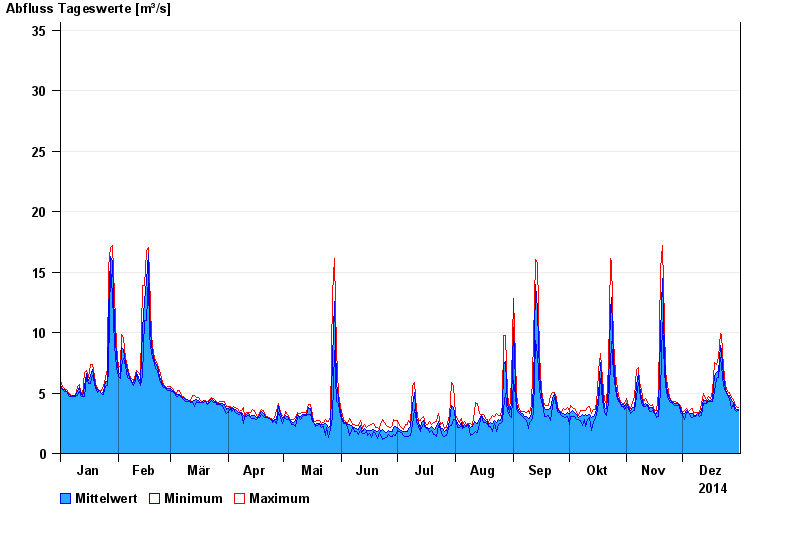
- Chart of year

Chart of year Hallerndorf / Aisch
Discharge from 01.01.2014 to 31.12.2014
 Für diesen Pegel sind keine Jährlichkeiten hinterlegt.
| Date | Mean value [m³/s] | Maximum [m³/s] | Minimum [m³/s] |
|---|---|---|---|
| 31.12.2014 | 3.63 | 3.79 | 3.55 |
| 30.12.2014 | 3.6 | 3.86 | 3.5 |
| 29.12.2014 | 3.88 | 4.12 | 3.67 |
| 28.12.2014 | 4.21 | 4.46 | 4.02 |
| 27.12.2014 | 4.38 | 4.64 | 3.72 |
| 26.12.2014 | 4.78 | 5.02 | 4.54 |
| 25.12.2014 | 4.91 | 5.11 | 4.76 |
© Bayerisches Landesamt für Umwelt 2024