
- Start >
- Rivers >
- Discharge >
- Oberer Main - Elbe >
- Grafenwöhr >
- Chart of year

Chart of year Grafenwöhr / Creußen
Discharge from 01.01.2024 to 20.04.2024
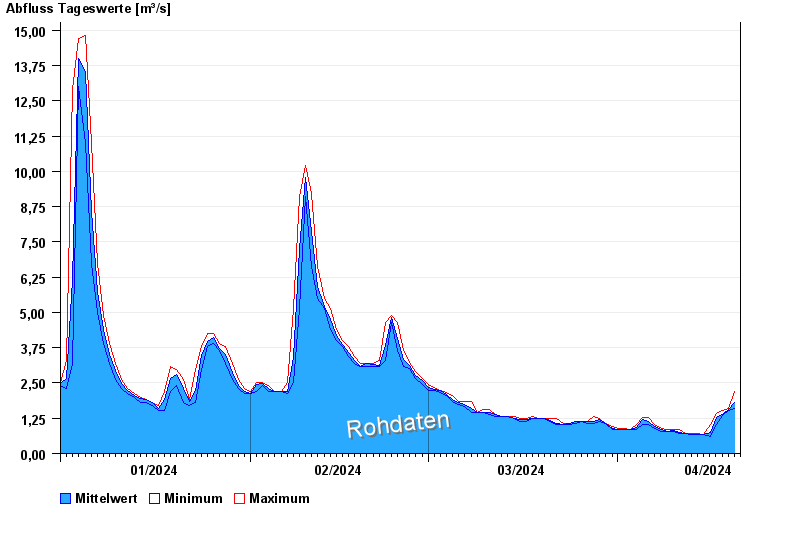
| Date | Mean value [m³/s] | Maximum [m³/s] | Minimum [m³/s] |
|---|---|---|---|
| 20.04.2024 | 1.61 | 1.61 | 1.61 |
| 19.04.2024 | 1.55 | 1.61 | 1.52 |
| 18.04.2024 | 1.38 | 1.52 | 1.34 |
| 17.04.2024 | 1.28 | 1.43 | 1.03 |
| 16.04.2024 | 0.739 | 1.03 | 0.619 |
| 15.04.2024 | 0.67 | 0.67 | 0.67 |
| 14.04.2024 | 0.672 | 0.723 | 0.67 |
© Bayerisches Landesamt für Umwelt 2024