
- Start >
- Rivers >
- Discharge >
- Oberer Main - Elbe >
- Goldbergsee Ablauf >
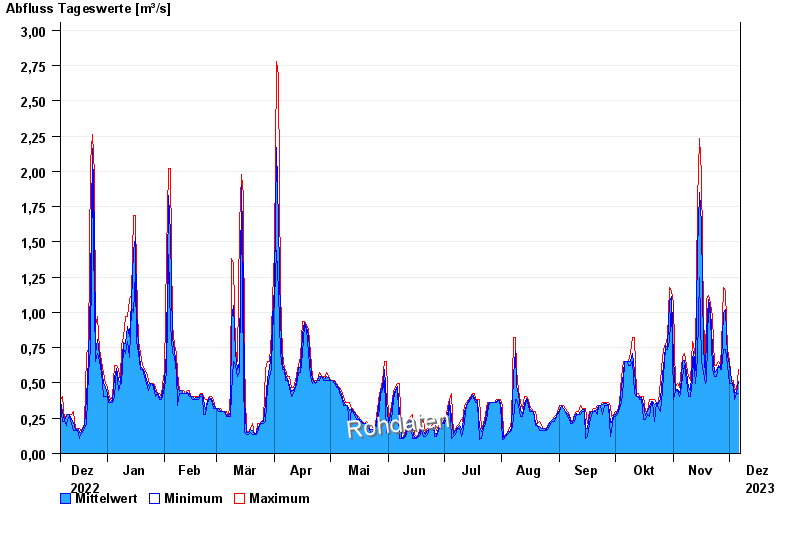
- Chart of year

Chart of year Goldbergsee Ablauf / Sulzbach
Discharge from 07.12.2022 to 06.12.2023
note
Beeinflussung des Abflusses aufgrund Hindernisse im Unterlauf.
| Date | Mean value [m³/s] | Maximum [m³/s] | Minimum [m³/s] |
|---|---|---|---|
| 06.12.2023 | 0.511 | 0.597 | 0.424 |
| 05.12.2023 | 0.432 | 0.446 | 0.424 |
| 04.12.2023 | 0.426 | 0.47 | 0.38 |
| 03.12.2023 | 0.48 | 0.519 | 0.47 |
| 02.12.2023 | 0.518 | 0.519 | 0.495 |
| 01.12.2023 | 0.628 | 0.651 | 0.495 |
| 30.11.2023 | 0.685 | 0.735 | 0.624 |
© Bayerisches Landesamt für Umwelt 2024