
- Start >
- Rivers >
- Discharge >
- Oberer Main - Elbe >
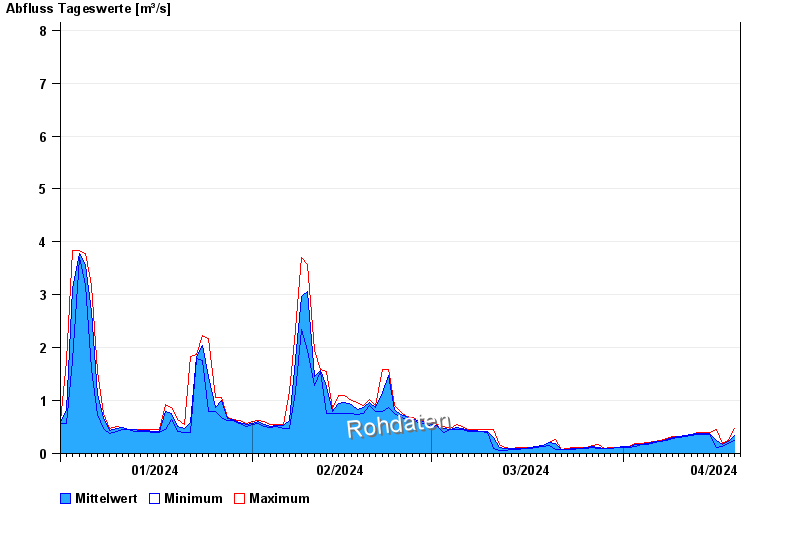
- Goldbergsee Ablauf >
- Chart of year

Chart of year Goldbergsee Ablauf / Sulzbach
Discharge from 01.01.2024 to 19.04.2024
 Für diesen Pegel sind keine Jährlichkeiten hinterlegt.
note
Beeinflussung des Abflusses aufgrund Hindernisse im Unterlauf.
| Date | Mean value [m³/s] | Maximum [m³/s] | Minimum [m³/s] |
|---|---|---|---|
| 19.04.2024 | 0.243 | 0.244 | 0.228 |
| 18.04.2024 | 0.22 | 0.244 | 0.195 |
| 17.04.2024 | 0.165 | 0.195 | 0.136 |
| 16.04.2024 | 0.248 | 0.446 | 0.122 |
| 15.04.2024 | 0.381 | 0.401 | 0.359 |
| 14.04.2024 | 0.376 | 0.401 | 0.359 |
| 13.04.2024 | 0.379 | 0.401 | 0.359 |
© Bayerisches Landesamt für Umwelt 2024