
- Start >
- Rivers >
- Discharge >
- Oberer Main - Elbe >
- Gampelmühle >
- Chart of year

Chart of year Gampelmühle / Ölschnitz
Discharge from 26.08.2019 to 25.08.2020
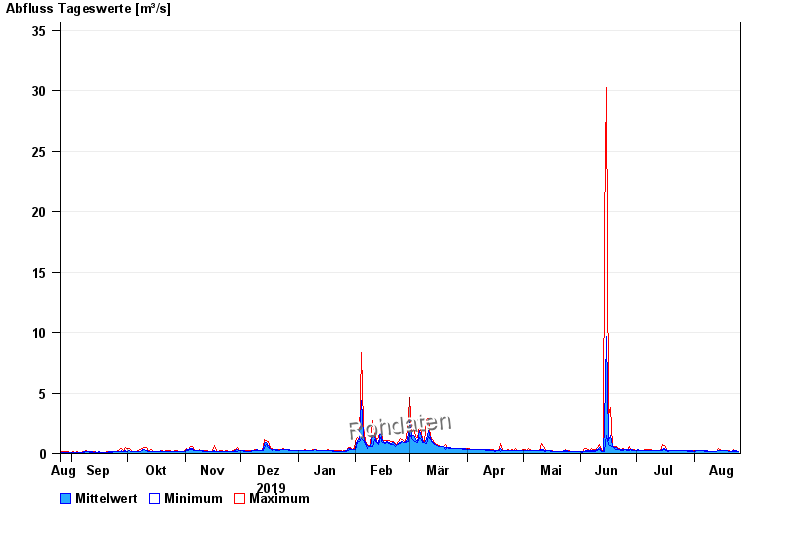
| Date | Mean value [m³/s] | Maximum [m³/s] | Minimum [m³/s] |
|---|---|---|---|
| 25.08.2020 | 0.205 | 0.205 | 0.205 |
| 24.08.2020 | 0.212 | 0.234 | 0.205 |
| 23.08.2020 | 0.228 | 0.266 | 0.205 |
| 22.08.2020 | 0.236 | 0.301 | 0.192 |
| 21.08.2020 | 0.199 | 0.205 | 0.192 |
| 20.08.2020 | 0.198 | 0.219 | 0.192 |
| 19.08.2020 | 0.219 | 0.234 | 0.219 |
© Bayerisches Landesamt für Umwelt 2024