
- Start >
- Rivers >
- Discharge >
- Oberer Main - Elbe >
- Gampelmühle >
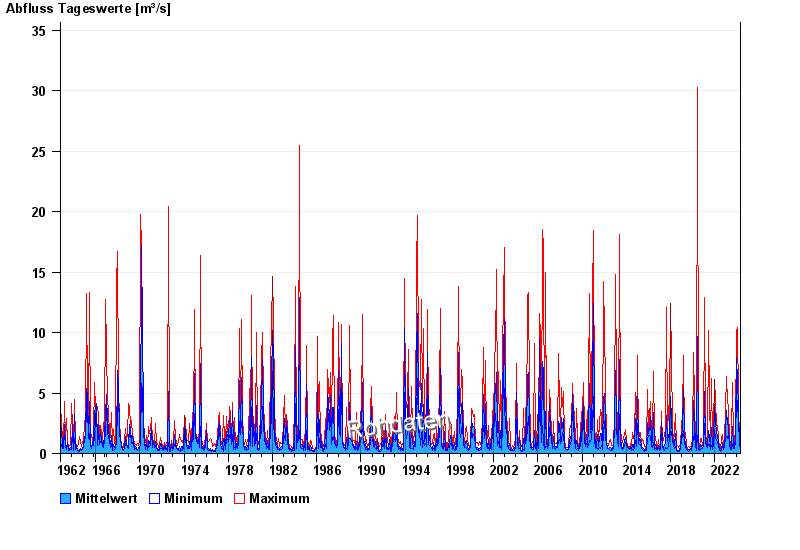
- Chart of total period

Chart of total period Gampelmühle / Ölschnitz
Discharge from 01.11.1962 to 26.04.2024
| Date | Mean value [m³/s] | Maximum [m³/s] | Minimum [m³/s] |
|---|---|---|---|
| 26.04.2024 | 0.672 | 0.672 | 0.672 |
| 25.04.2024 | 0.699 | 0.725 | 0.672 |
| 24.04.2024 | 0.777 | 0.808 | 0.725 |
| 23.04.2024 | 0.949 | 1.13 | 0.837 |
| 22.04.2024 | 1.4 | 2.22 | 1.04 |
| 21.04.2024 | 1.66 | 3.05 | 0.594 |
| 20.04.2024 | 0.707 | 0.837 | 0.62 |
© Bayerisches Landesamt für Umwelt 2024