
- Start >
- Rivers >
- Discharge >
- Oberer Main - Elbe >
- Friedersreuth >
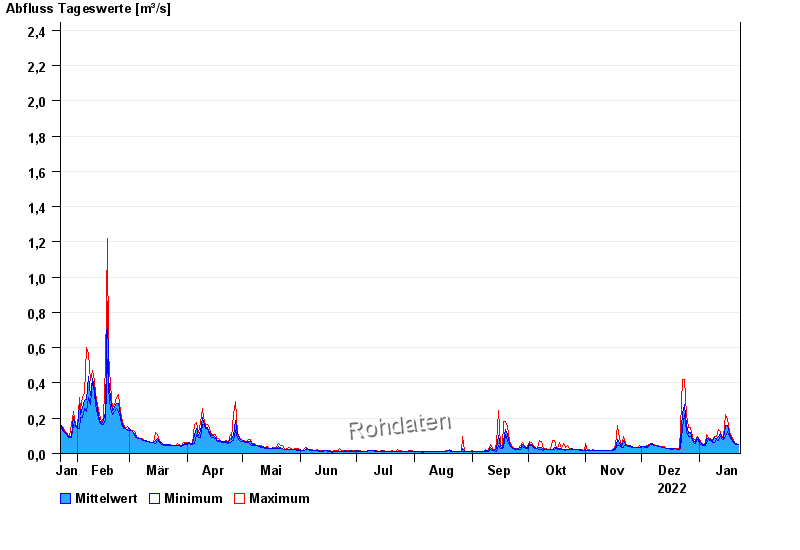
- Chart of year

Chart of year Friedersreuth / Schweinnaab
Discharge from 23.01.2022 to 22.01.2023
 Für diesen Pegel sind keine Jährlichkeiten hinterlegt.
| Date | Mean value [m³/s] | Maximum [m³/s] | Minimum [m³/s] |
|---|---|---|---|
| 22.01.2023 | 0.053 | 0.053 | 0.053 |
| 21.01.2023 | 0.055 | 0.058 | 0.053 |
| 20.01.2023 | 0.061 | 0.064 | 0.058 |
| 19.01.2023 | 0.069 | 0.079 | 0.064 |
| 18.01.2023 | 0.084 | 0.096 | 0.079 |
| 17.01.2023 | 0.111 | 0.127 | 0.096 |
| 16.01.2023 | 0.156 | 0.191 | 0.127 |
© Bayerisches Landesamt für Umwelt 2024