
- Start >
- Rivers >
- Discharge >
- Oberer Main - Elbe >
- Friedersdorf >
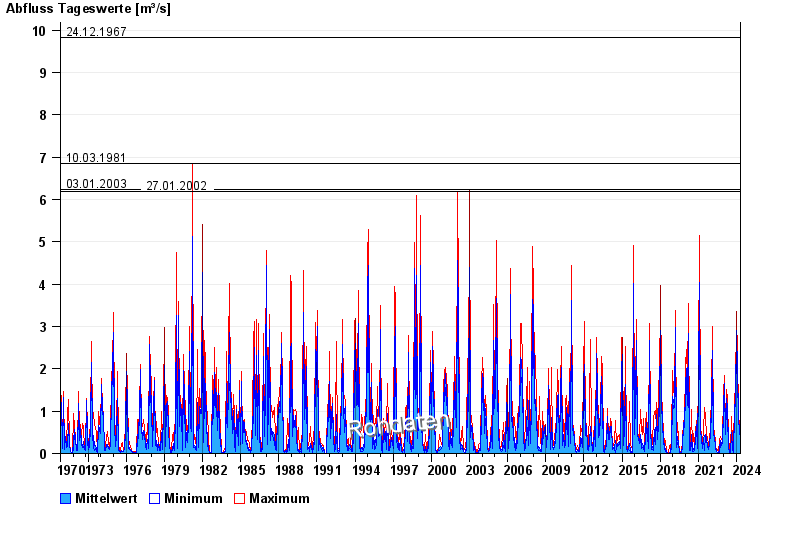
- Chart of total period

Chart of total period Friedersdorf / Buchbach
Discharge from 01.11.1970 to 23.04.2024
- 31.03.1962 Abfluss: 15,7 m³/s
- 24.12.1967 Abfluss: 9,83 m³/s
- 10.03.1981 Abfluss: 6,86 m³/s
- 03.01.2003 Abfluss: 6,24 m³/s
- 27.01.2002 Abfluss: 6,18 m³/s
| Date | Mean value [m³/s] | Maximum [m³/s] | Minimum [m³/s] |
|---|---|---|---|
| 23.04.2024 | 0.445 | 0.445 | 0.445 |
| 22.04.2024 | 0.466 | 0.476 | 0.445 |
| 21.04.2024 | 0.471 | 0.476 | 0.445 |
| 20.04.2024 | 0.446 | 0.51 | 0.39 |
| 19.04.2024 | 0.324 | 0.476 | 0.21 |
| 18.04.2024 | 0.238 | 0.252 | 0.219 |
| 17.04.2024 | 0.264 | 0.313 | 0.241 |
© Bayerisches Landesamt für Umwelt 2024