
- Start >
- Rivers >
- Discharge >
- Oberer Main - Elbe >
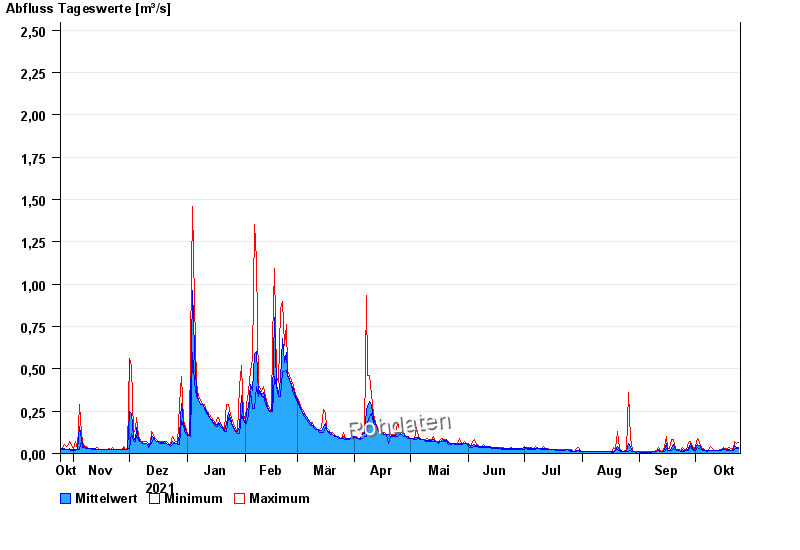
- Förmitz Speicherzufluss >
- Chart of year

Chart of year Förmitz Speicherzufluss / Förmitz
Discharge from 25.10.2021 to 24.10.2022
 Für diesen Pegel sind keine Jährlichkeiten hinterlegt.
| Date | Mean value [m³/s] | Maximum [m³/s] | Minimum [m³/s] |
|---|---|---|---|
| 24.10.2022 | 0.036 | 0.064 | 0.03 |
| 23.10.2022 | 0.034 | 0.057 | 0.03 |
| 22.10.2022 | 0.045 | 0.073 | 0.024 |
| 21.10.2022 | 0.023 | 0.03 | 0.02 |
| 20.10.2022 | 0.02 | 0.03 | 0.016 |
| 19.10.2022 | 0.023 | 0.036 | 0.02 |
| 18.10.2022 | 0.023 | 0.03 | 0.02 |
© Bayerisches Landesamt für Umwelt 2024