
- Start >
- Rivers >
- Discharge >
- Oberer Main - Elbe >
- Förmitz Speicherzufluss >
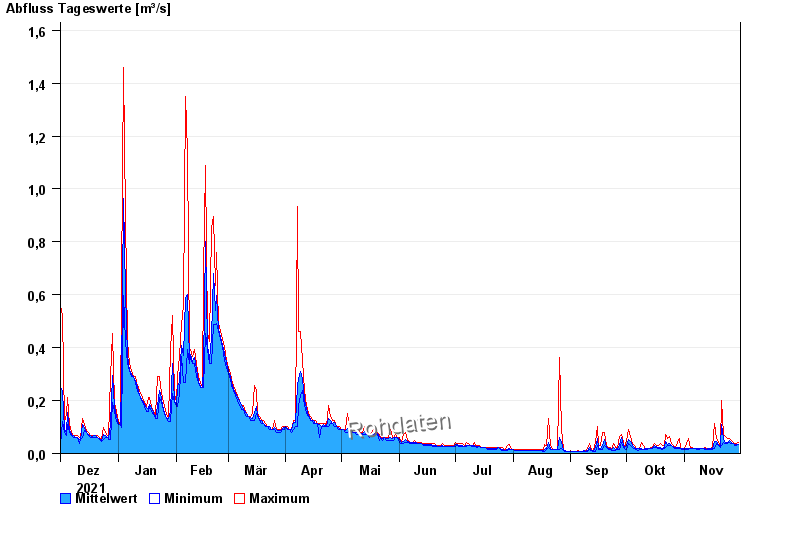
- Chart of year

Chart of year Förmitz Speicherzufluss / Förmitz
Discharge from 01.12.2021 to 30.11.2022
| Date | Mean value [m³/s] | Maximum [m³/s] | Minimum [m³/s] |
|---|---|---|---|
| 30.11.2022 | 0.035 | 0.041 | 0.035 |
| 29.11.2022 | 0.033 | 0.036 | 0.03 |
| 28.11.2022 | 0.033 | 0.036 | 0.03 |
| 27.11.2022 | 0.038 | 0.043 | 0.036 |
| 26.11.2022 | 0.042 | 0.05 | 0.036 |
| 25.11.2022 | 0.047 | 0.057 | 0.043 |
| 24.11.2022 | 0.042 | 0.057 | 0.036 |
© Bayerisches Landesamt für Umwelt 2024