
- Start >
- Rivers >
- Discharge >
- Oberer Main - Elbe >
- Förmitz Speicherzufluss >
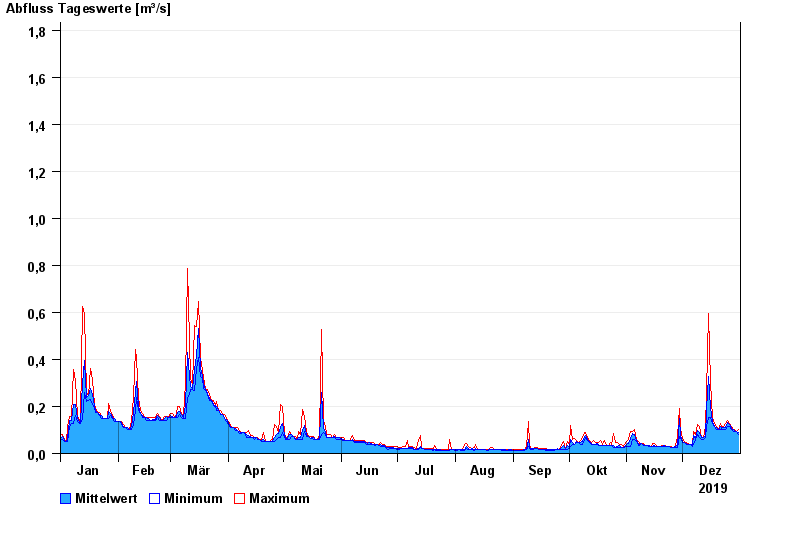
- Chart of year

Chart of year Förmitz Speicherzufluss / Förmitz
Discharge from 01.01.2019 to 31.12.2019
 Für diesen Pegel sind keine Jährlichkeiten hinterlegt.
| Date | Mean value [m³/s] | Maximum [m³/s] | Minimum [m³/s] |
|---|---|---|---|
| 31.12.2019 | 0.109 | 0.128 | 0.102 |
| 30.12.2019 | 0.115 | 0.115 | 0.115 |
| 29.12.2019 | 0.116 | 0.128 | 0.115 |
| 28.12.2019 | 0.127 | 0.128 | 0.115 |
| 27.12.2019 | 0.134 | 0.142 | 0.128 |
| 26.12.2019 | 0.15 | 0.156 | 0.142 |
| 25.12.2019 | 0.161 | 0.171 | 0.142 |
© Bayerisches Landesamt für Umwelt 2024