
- Start >
- Rivers >
- Discharge >
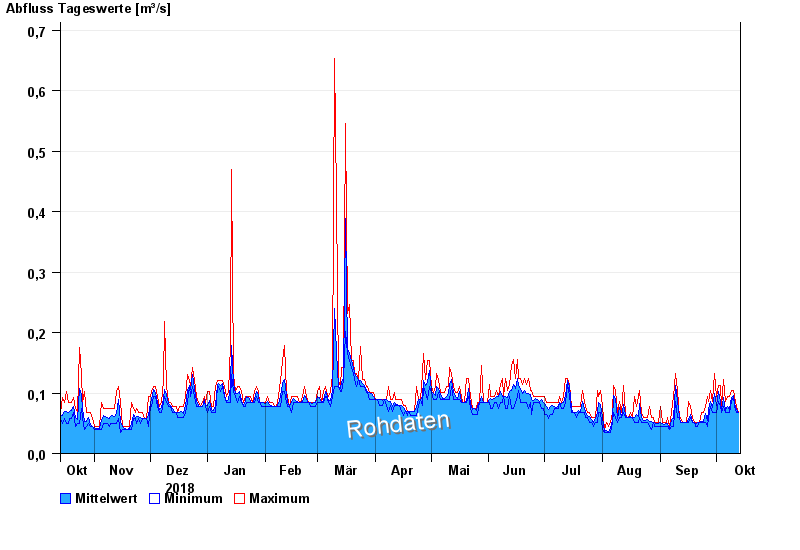
- Oberer Main - Elbe >
- Fahrenbühl >
- Chart of year

Chart of year Fahrenbühl / Lamitz
Discharge from 14.10.2018 to 13.10.2019
note
Schlechte Netzanbindung
| Date | Mean value [m³/s] | Maximum [m³/s] | Minimum [m³/s] |
|---|---|---|---|
| 13.10.2019 | 0.068 | 0.068 | 0.068 |
| 12.10.2019 | 0.073 | 0.077 | 0.068 |
| 11.10.2019 | 0.083 | 0.095 | 0.077 |
| 10.10.2019 | 0.097 | 0.104 | 0.095 |
| 09.10.2019 | 0.093 | 0.104 | 0.086 |
| 08.10.2019 | 0.072 | 0.095 | 0.068 |
| 07.10.2019 | 0.078 | 0.095 | 0.068 |
© Bayerisches Landesamt für Umwelt 2024