
- Start >
- Rivers >
- Discharge >
- Oberer Main - Elbe >
- Fahrenbühl >
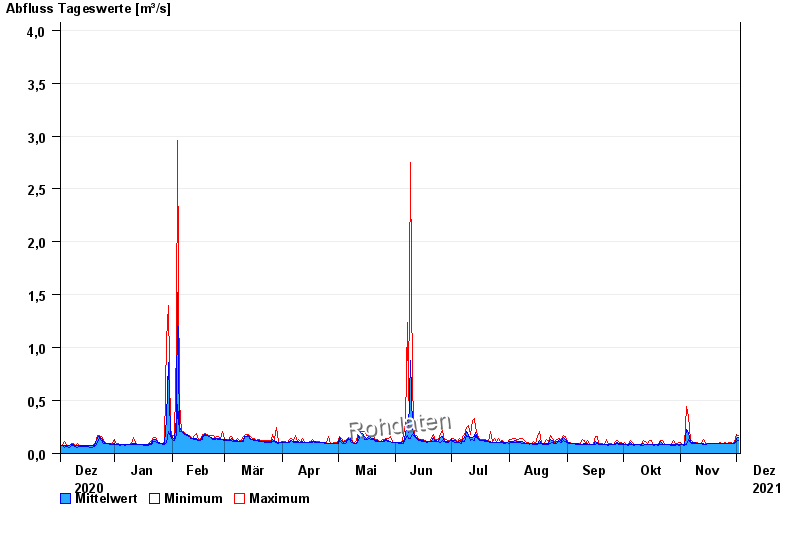
- Chart of year

Chart of year Fahrenbühl / Lamitz
Discharge from 03.12.2020 to 02.12.2021
note
Schlechte Netzanbindung
- 07.02.1984 Abfluss: 9,47 m³/s
- 23.01.1995 Abfluss: 8,61 m³/s
- 26.12.1974 Abfluss: 8,55 m³/s
- 04.08.1969 Abfluss: 8,35 m³/s
- 12.02.2005 Abfluss: 7,97 m³/s
| Date | Mean value [m³/s] | Maximum [m³/s] | Minimum [m³/s] |
|---|---|---|---|
| 02.12.2021 | 0.154 | 0.167 | 0.123 |
| 01.12.2021 | 0.145 | 0.179 | 0.113 |
| 30.11.2021 | 0.097 | 0.113 | 0.092 |
| 29.11.2021 | 0.092 | 0.092 | 0.092 |
| 28.11.2021 | 0.093 | 0.102 | 0.092 |
| 27.11.2021 | 0.094 | 0.102 | 0.092 |
| 26.11.2021 | 0.092 | 0.092 | 0.092 |
© Bayerisches Landesamt für Umwelt 2024