
- Start >
- Rivers >
- Discharge >
- Oberer Main - Elbe >
- Fahrenbühl >
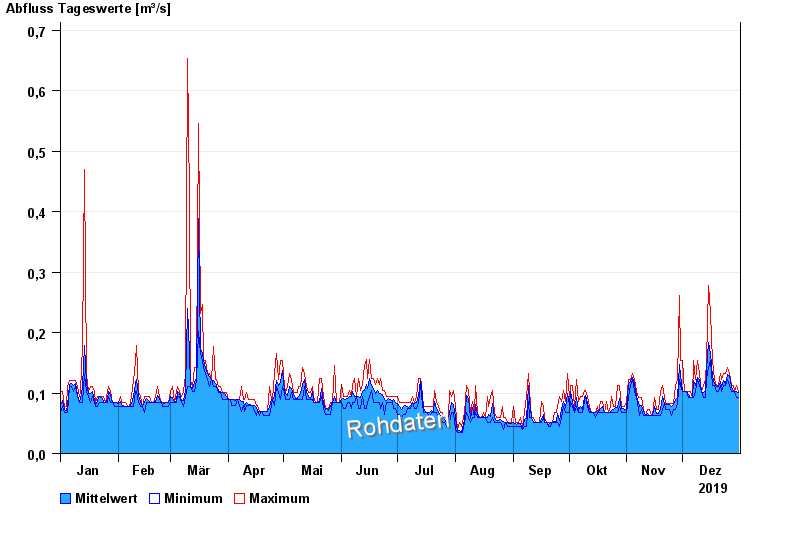
- Chart of year

Chart of year Fahrenbühl / Lamitz
Discharge from 01.01.2019 to 31.12.2019
note
Schlechte Netzanbindung
- 07.02.1984 Abfluss: 9,47 m³/s
- 23.01.1995 Abfluss: 8,61 m³/s
- 26.12.1974 Abfluss: 8,55 m³/s
- 04.08.1969 Abfluss: 8,35 m³/s
- 12.02.2005 Abfluss: 7,97 m³/s
| Date | Mean value [m³/s] | Maximum [m³/s] | Minimum [m³/s] |
|---|---|---|---|
| 31.12.2019 | 0.101 | 0.102 | 0.092 |
| 30.12.2019 | 0.102 | 0.112 | 0.092 |
| 29.12.2019 | 0.102 | 0.102 | 0.102 |
| 28.12.2019 | 0.103 | 0.112 | 0.102 |
| 27.12.2019 | 0.111 | 0.112 | 0.102 |
| 26.12.2019 | 0.129 | 0.133 | 0.112 |
| 25.12.2019 | 0.131 | 0.143 | 0.122 |
© Bayerisches Landesamt für Umwelt 2024