
- Start >
- Rivers >
- Discharge >
- Oberer Main - Elbe >
- Erbendorf >
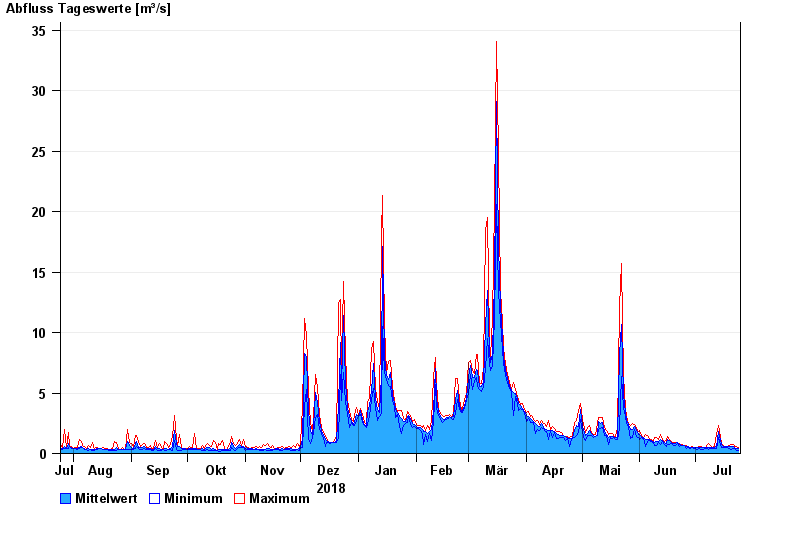
- Chart of year

Chart of year Erbendorf / Fichtelnaab
Discharge from 25.07.2018 to 24.07.2019
| Date | Mean value [m³/s] | Maximum [m³/s] | Minimum [m³/s] |
|---|---|---|---|
| 24.07.2019 | 0.398 | 0.484 | 0.276 |
| 23.07.2019 | 0.443 | 0.572 | 0.276 |
| 22.07.2019 | 0.502 | 0.572 | 0.405 |
| 21.07.2019 | 0.542 | 0.717 | 0.444 |
| 20.07.2019 | 0.544 | 0.77 | 0.37 |
| 19.07.2019 | 0.555 | 0.667 | 0.444 |
| 18.07.2019 | 0.559 | 0.619 | 0.528 |
© Bayerisches Landesamt für Umwelt 2024