
- Start >
- Rivers >
- Discharge >
- Oberer Main - Elbe >
- Erbendorf >
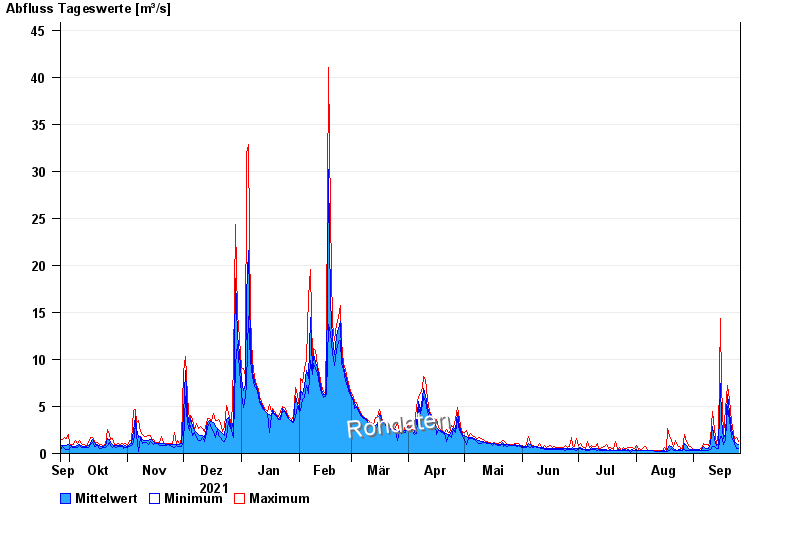
- Chart of year

Chart of year Erbendorf / Fichtelnaab
Discharge from 26.09.2021 to 25.09.2022
| Date | Mean value [m³/s] | Maximum [m³/s] | Minimum [m³/s] |
|---|---|---|---|
| 25.09.2022 | 0.923 | 1.26 | 0.515 |
| 24.09.2022 | 1.05 | 1.72 | 0.56 |
| 23.09.2022 | 1.3 | 1.48 | 1.05 |
| 22.09.2022 | 1.66 | 2.15 | 1.26 |
| 21.09.2022 | 2.59 | 3.37 | 1.81 |
| 20.09.2022 | 4.38 | 5.77 | 3.48 |
| 19.09.2022 | 6.23 | 7.23 | 4.96 |
© Bayerisches Landesamt für Umwelt 2024