
- Start >
- Rivers >
- Discharge >
- Oberer Main - Elbe >
- Erbendorf >
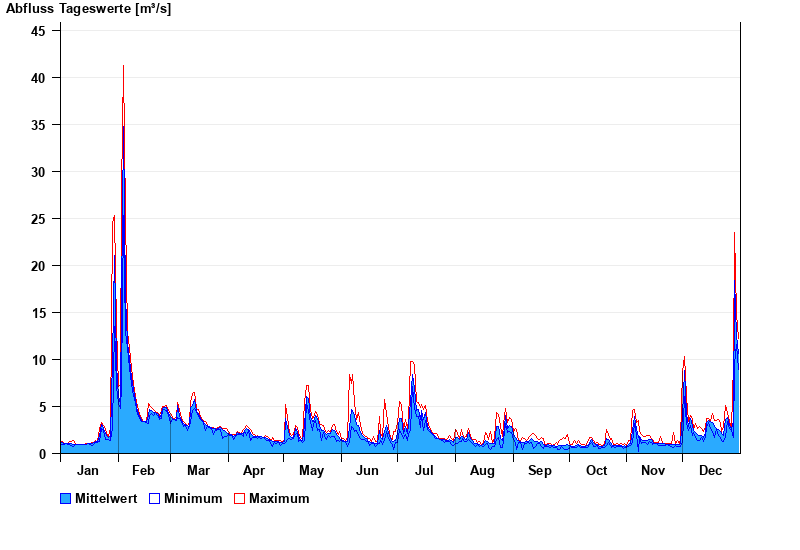
- Chart of year

Chart of year Erbendorf / Fichtelnaab
Discharge from 01.01.2021 to 31.12.2021
| Date | Mean value [m³/s] | Maximum [m³/s] | Minimum [m³/s] |
|---|---|---|---|
| 31.12.2021 | 10.6 | 12.2 | 8.92 |
| 30.12.2021 | 12.5 | 14.9 | 11.6 |
| 29.12.2021 | 18.6 | 24.3 | 9.46 |
| 28.12.2021 | 3.44 | 9.46 | 1.65 |
| 27.12.2021 | 2.52 | 2.61 | 2.42 |
| 26.12.2021 | 2.93 | 3.38 | 2.61 |
| 25.12.2021 | 3.83 | 4.21 | 3.38 |
© Bayerisches Landesamt für Umwelt 2024