
- Start >
- Rivers >
- Discharge >
- Oberer Main - Elbe >
- Erbendorf >
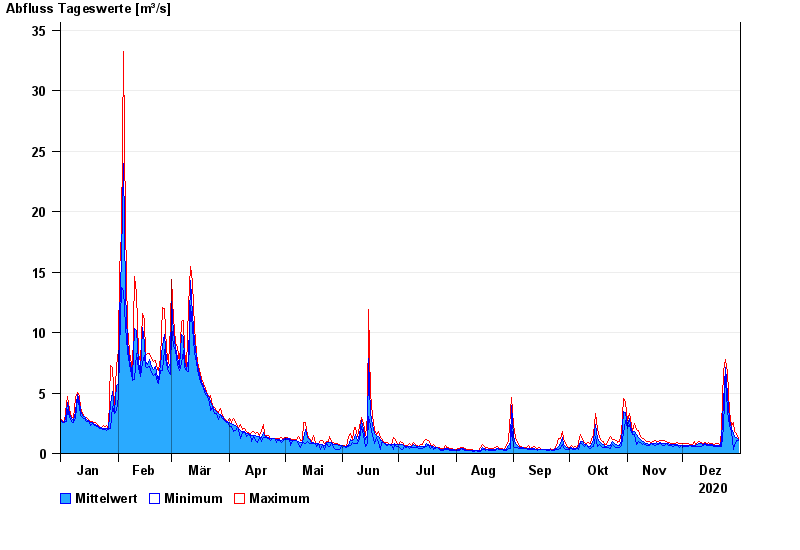
- Chart of year

Chart of year Erbendorf / Fichtelnaab
Discharge from 01.01.2020 to 31.12.2020
| Date | Mean value [m³/s] | Maximum [m³/s] | Minimum [m³/s] |
|---|---|---|---|
| 31.12.2020 | 1.16 | 1.24 | 1.1 |
| 30.12.2020 | 1.32 | 1.62 | 1.1 |
| 29.12.2020 | 1.37 | 1.86 | 0.687 |
| 28.12.2020 | 1.65 | 2.56 | 0.348 |
| 27.12.2020 | 2.08 | 2.29 | 1.78 |
| 26.12.2020 | 2.79 | 3.44 | 2.29 |
| 25.12.2020 | 4.81 | 6.68 | 3.44 |
© Bayerisches Landesamt für Umwelt 2024