
- Start >
- Rivers >
- Discharge >
- Oberer Main - Elbe >
- Erbendorf >
- Chart of year

Chart of year Erbendorf / Fichtelnaab
Discharge from 26.09.2020 to 25.09.2021
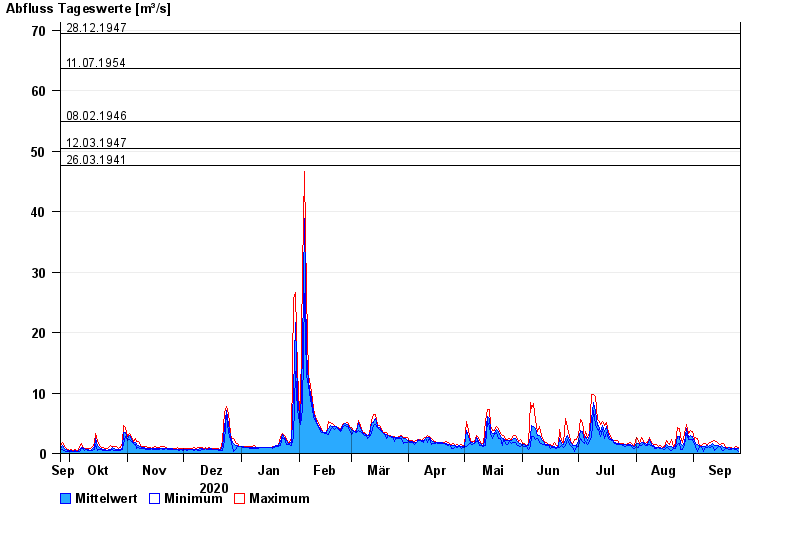
- 28.12.1947 Abfluss: 69,5 m³/s
- 11.07.1954 Abfluss: 63,6 m³/s
- 08.02.1946 Abfluss: 54,9 m³/s
- 12.03.1947 Abfluss: 50,4 m³/s
- 26.03.1941 Abfluss: 47,7 m³/s
| Date | Mean value [m³/s] | Maximum [m³/s] | Minimum [m³/s] |
|---|---|---|---|
| 25.09.2021 | 0.754 | 0.943 | 0.402 |
| 24.09.2021 | 0.796 | 1.21 | 0.619 |
| 23.09.2021 | 0.807 | 0.944 | 0.619 |
| 22.09.2021 | 0.861 | 0.886 | 0.773 |
| 21.09.2021 | 0.87 | 1.01 | 0.62 |
| 20.09.2021 | 0.946 | 1.07 | 0.721 |
| 19.09.2021 | 0.903 | 0.948 | 0.775 |
© Bayerisches Landesamt für Umwelt 2024