
- Start >
- Rivers >
- Discharge >
- Oberer Main - Elbe >
- Erbendorf >
- Chart of total period

Chart of total period Erbendorf / Fichtelnaab
Discharge from 01.11.1929 to 20.04.2024
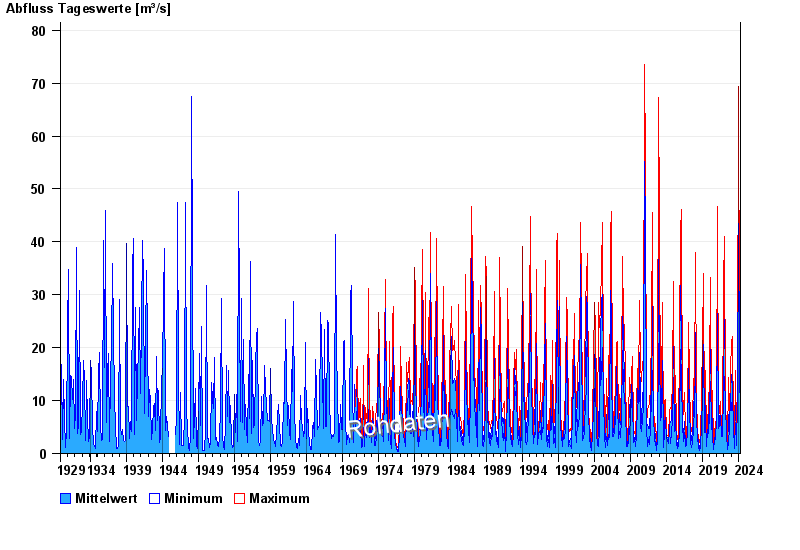
| Date | Mean value [m³/s] | Maximum [m³/s] | Minimum [m³/s] |
|---|---|---|---|
| 20.04.2024 | 6.19 | 7.6 | 4.96 |
| 19.04.2024 | 2.21 | 4.85 | 1.05 |
| 18.04.2024 | 1.89 | 2.14 | 1.48 |
| 17.04.2024 | 2.49 | 2.97 | 1.64 |
| 16.04.2024 | 1.69 | 2.78 | 1.26 |
| 15.04.2024 | 1.38 | 1.56 | 0.923 |
| 14.04.2024 | 1.43 | 1.56 | 1.41 |
© Bayerisches Landesamt für Umwelt 2024