
- Start >
- Rivers >
- Discharge >
- Oberer Main - Elbe >
- Coburg >
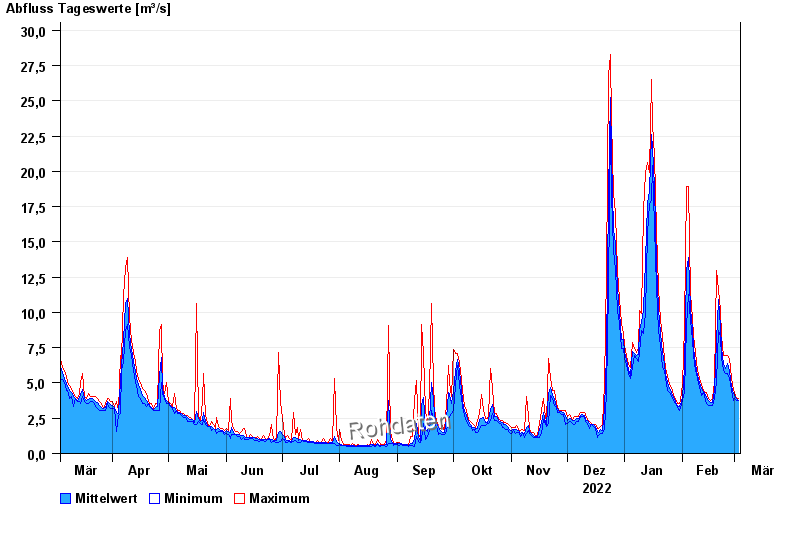
- Chart of year

Chart of year Coburg / Itz
Discharge from 04.03.2022 to 03.03.2023
| Date | Mean value [m³/s] | Maximum [m³/s] | Minimum [m³/s] |
|---|---|---|---|
| 03.03.2023 | 3.78 | 3.93 | 3.74 |
| 02.03.2023 | 3.88 | 3.93 | 3.74 |
| 01.03.2023 | 4.09 | 4.3 | 3.93 |
| 28.02.2023 | 4.28 | 4.49 | 3.74 |
| 27.02.2023 | 4.74 | 5.28 | 4.49 |
| 26.02.2023 | 5.8 | 6.73 | 5.28 |
| 25.02.2023 | 6.36 | 6.97 | 5.69 |
© Bayerisches Landesamt für Umwelt 2024