
- Start >
- Rivers >
- Discharge >
- Oberer Main - Elbe >
- Coburg >
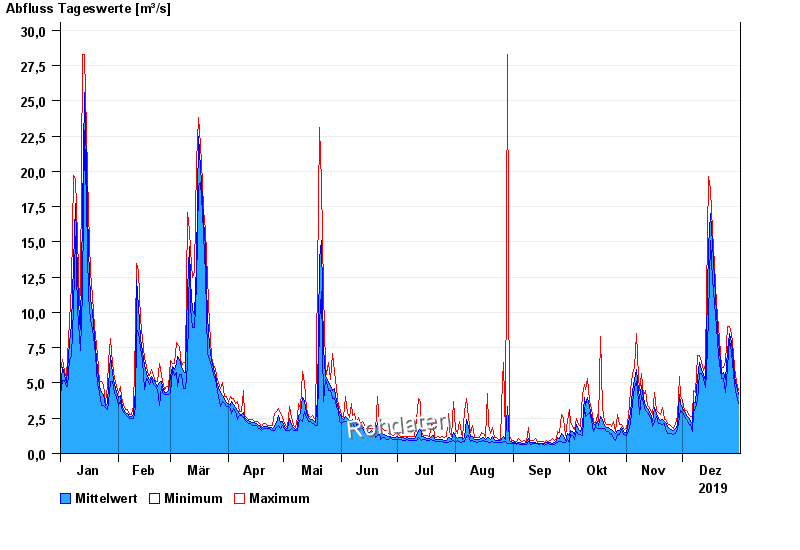
- Chart of year

Chart of year Coburg / Itz
Discharge from 01.01.2019 to 31.12.2019
| Date | Mean value [m³/s] | Maximum [m³/s] | Minimum [m³/s] |
|---|---|---|---|
| 31.12.2019 | 4.16 | 4.49 | 3.57 |
| 30.12.2019 | 4.76 | 5.08 | 4.11 |
| 29.12.2019 | 5.48 | 6.1 | 4.88 |
| 28.12.2019 | 6.46 | 7.17 | 5.69 |
| 27.12.2019 | 7.84 | 8.53 | 7.17 |
| 26.12.2019 | 8.48 | 8.99 | 8.07 |
| 25.12.2019 | 7.3 | 8.99 | 6.1 |
© Bayerisches Landesamt für Umwelt 2024