
- Start >
- Rivers >
- Discharge >
- Oberer Main - Elbe >
- Coburg >
- Chart of year

Chart of year Coburg / Itz
Discharge from 04.03.2020 to 03.03.2021
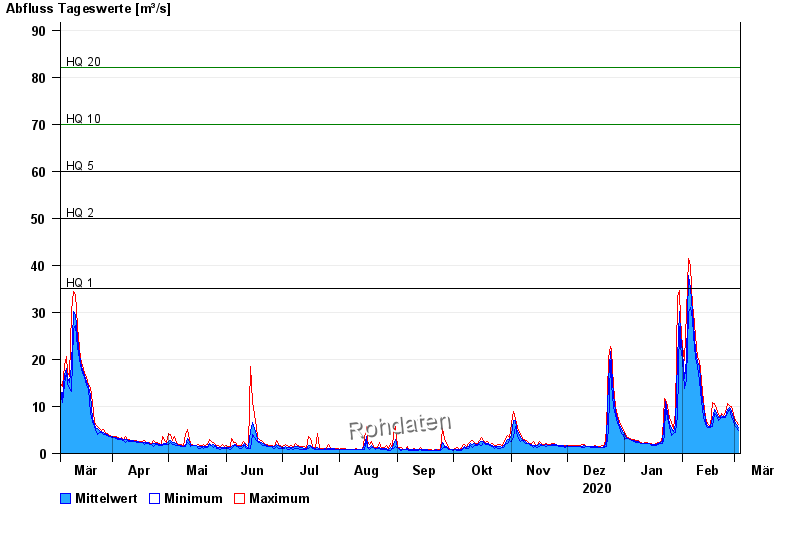
- HQ1 35 m³/s
- HQ2 50 m³/s
- HQ5 60 m³/s
- HQ10 70 m³/s
- HQ20 82 m³/s
- HQ50 95 m³/s
- HQ100 110 m³/s
| Date | Mean value [m³/s] | Maximum [m³/s] | Minimum [m³/s] |
|---|---|---|---|
| 03.03.2021 | 5.51 | 6.08 | 4.85 |
| 02.03.2021 | 6.06 | 6.72 | 5.46 |
| 01.03.2021 | 6.74 | 7.38 | 5.87 |
| 28.02.2021 | 7.76 | 8.5 | 6.72 |
| 27.02.2021 | 8.91 | 9.89 | 7.83 |
| 26.02.2021 | 9.84 | 10.1 | 9.43 |
| 25.02.2021 | 9.37 | 10.6 | 8.5 |
© Bayerisches Landesamt für Umwelt 2024