
- Start >
- Rivers >
- Discharge >
- Oberer Main - Elbe >
- Coburg >
- Chart of total period

Chart of total period Coburg / Itz
Discharge from 01.11.1925 to 24.04.2024
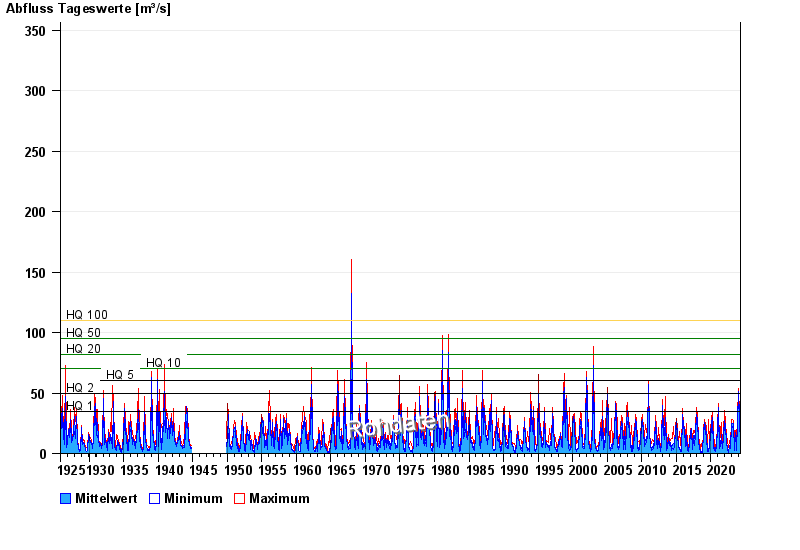
- HQ1 35 m³/s
- HQ2 50 m³/s
- HQ5 60 m³/s
- HQ10 70 m³/s
- HQ20 82 m³/s
- HQ50 95 m³/s
- HQ100 110 m³/s
| Date | Mean value [m³/s] | Maximum [m³/s] | Minimum [m³/s] |
|---|---|---|---|
| 24.04.2024 | 5.7 | 6.01 | 5.6 |
| 23.04.2024 | 6.27 | 6.66 | 6.01 |
| 22.04.2024 | 7.1 | 7.75 | 6.66 |
| 21.04.2024 | 8.73 | 9.34 | 7.75 |
| 20.04.2024 | 8.73 | 10.8 | 5.8 |
| 19.04.2024 | 5.39 | 13.8 | 2.99 |
| 18.04.2024 | 3.34 | 3.85 | 2.83 |
© Bayerisches Landesamt für Umwelt 2024