
- Start >
- Rivers >
- Discharge >
- Oberer Main - Elbe >
- Bayreuth >
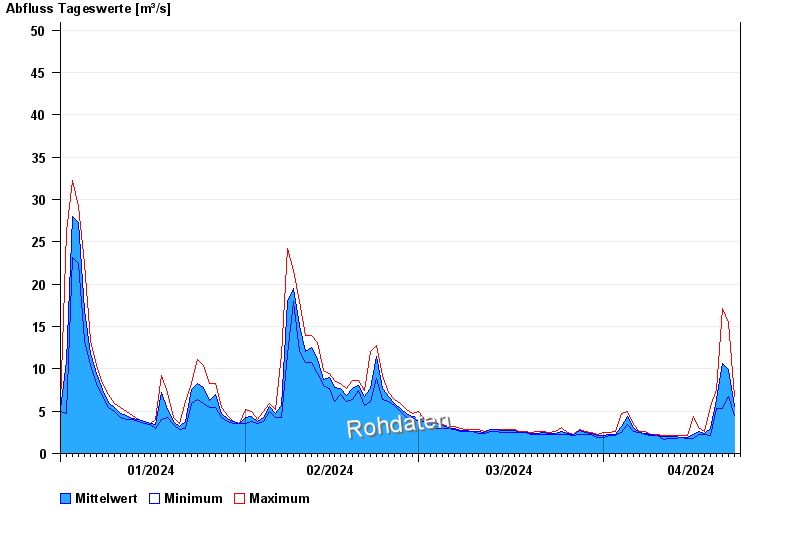
- Chart of year

Chart of year Bayreuth / Roter Main
Discharge from 01.01.2024 to 23.04.2024
- 26.01.1995 Abfluss: 148 m³/s
- 23.02.1970 Abfluss: 130 m³/s
- 02.03.1956 Abfluss: 130 m³/s
- 10.11.1927 Abfluss: 128 m³/s
- 15.01.1968 Abfluss: 120 m³/s
| Date | Mean value [m³/s] | Maximum [m³/s] | Minimum [m³/s] |
|---|---|---|---|
| 23.04.2024 | 6.24 | 6.78 | 5.5 |
| 22.04.2024 | 9.87 | 15.5 | 6.78 |
| 21.04.2024 | 10.6 | 17.1 | 5.26 |
| 20.04.2024 | 6.43 | 7.59 | 5.26 |
| 19.04.2024 | 3.01 | 5.5 | 2.1 |
| 18.04.2024 | 2.4 | 2.64 | 2.27 |
| 17.04.2024 | 2.57 | 3.03 | 2.27 |
© Bayerisches Landesamt für Umwelt 2024