
- Start >
- Rivers >
- Discharge >
- Oberer Main - Elbe >
- Bayreuth >
- Chart of total period

Chart of total period Bayreuth / Roter Main
Discharge from 01.11.1924 to 19.04.2024
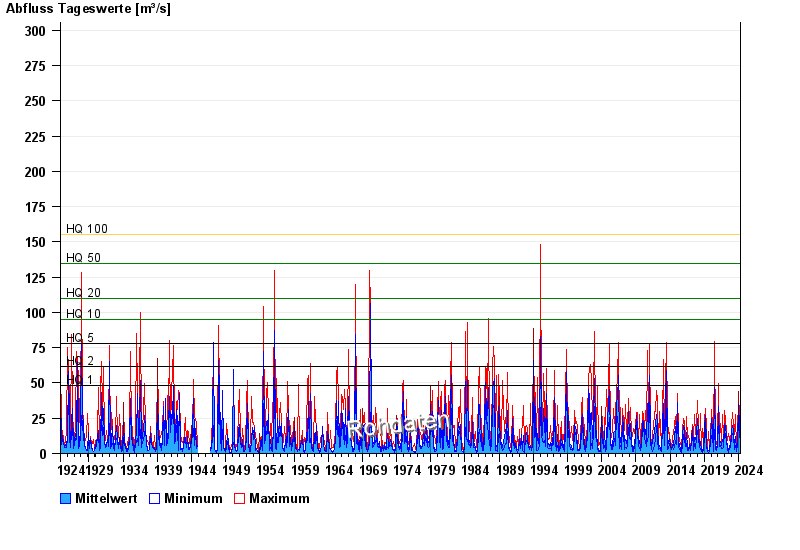
- HQ1 48 m³/s
- HQ2 62 m³/s
- HQ5 78 m³/s
- HQ10 95 m³/s
- HQ20 110 m³/s
- HQ50 135 m³/s
- HQ100 155 m³/s
| Date | Mean value [m³/s] | Maximum [m³/s] | Minimum [m³/s] |
|---|---|---|---|
| 19.04.2024 | 2.38 | 2.46 | 2.27 |
| 18.04.2024 | 2.4 | 2.64 | 2.27 |
| 17.04.2024 | 2.57 | 3.03 | 2.27 |
| 16.04.2024 | 2.2 | 4.32 | 1.77 |
| 15.04.2024 | 1.92 | 2.1 | 1.77 |
| 14.04.2024 | 1.94 | 2.1 | 1.93 |
| 13.04.2024 | 1.95 | 2.1 | 1.77 |
© Bayerisches Landesamt für Umwelt 2024