
- Start >
- Rivers >
- Discharge >
- Oberer Main - Elbe >
- Bärenthal >
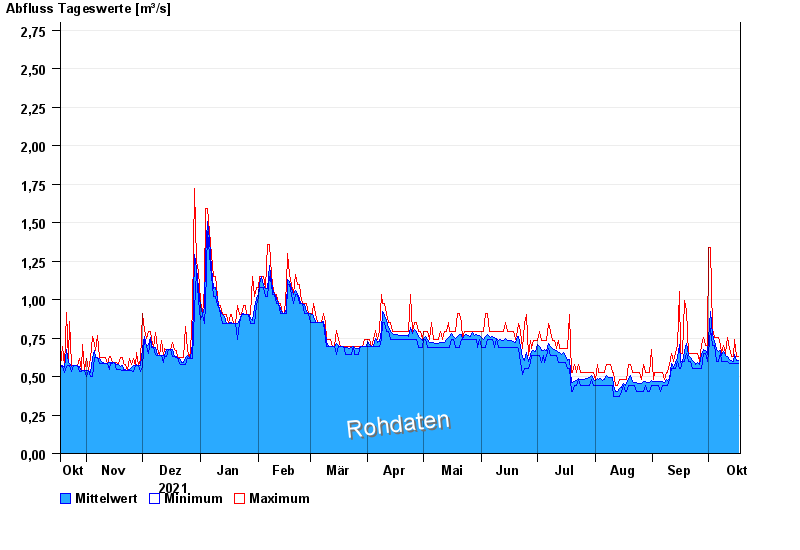
- Chart of year

Chart of year Bärenthal / Trubach
Discharge from 18.10.2021 to 17.10.2022
note
Absinken des Wasserstandes wegen Entfernung von Auflandungen.
- 01.03.1956 Abfluss: 12 m³/s
- 01.02.1950 Abfluss: 7,4 m³/s
- 01.03.1955 Abfluss: 5,2 m³/s
- 22.12.1991 Abfluss: 3,48 m³/s
- 20.07.2011 Abfluss: 3,42 m³/s
| Date | Mean value [m³/s] | Maximum [m³/s] | Minimum [m³/s] |
|---|---|---|---|
| 17.10.2022 | 0.603 | 0.633 | 0.583 |
| 16.10.2022 | 0.606 | 0.633 | 0.583 |
| 15.10.2022 | 0.646 | 0.738 | 0.583 |
| 14.10.2022 | 0.599 | 0.633 | 0.583 |
| 13.10.2022 | 0.605 | 0.633 | 0.583 |
| 12.10.2022 | 0.608 | 0.683 | 0.583 |
| 11.10.2022 | 0.632 | 0.755 | 0.599 |
© Bayerisches Landesamt für Umwelt 2024