
- Start >
- Rivers >
- Discharge >
- Oberer Main - Elbe >
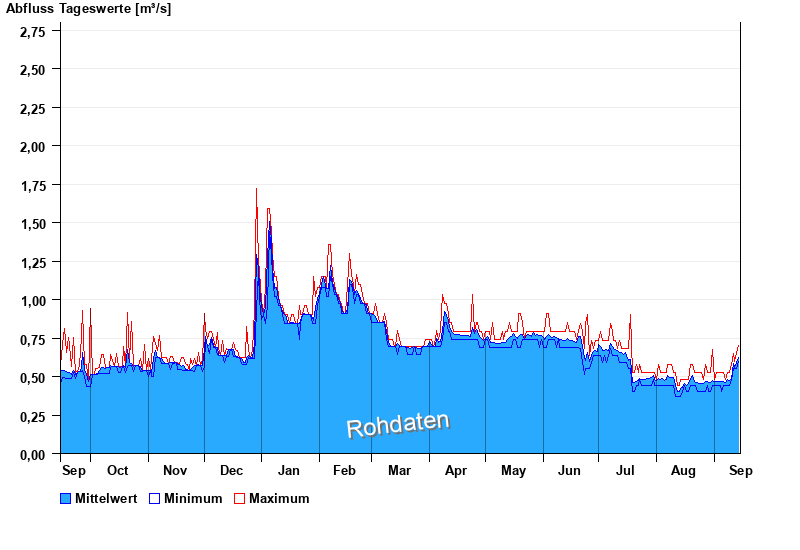
- Bärenthal >
- Chart of year

Chart of year Bärenthal / Trubach
Discharge from 15.09.2021 to 14.09.2022
- 22.12.1991 Abfluss: 3,88 m³/s
- 26.01.1995 Abfluss: 3,45 m³/s
- 20.07.2011 Abfluss: 3,26 m³/s
- 13.01.2011 Abfluss: 3,18 m³/s
- 20.03.2002 Abfluss: 3,14 m³/s
| Date | Mean value [m³/s] | Maximum [m³/s] | Minimum [m³/s] |
|---|---|---|---|
| 14.09.2022 | 0.623 | 0.7 | 0.599 |
| 13.09.2022 | 0.59 | 0.649 | 0.553 |
| 12.09.2022 | 0.56 | 0.599 | 0.553 |
| 11.09.2022 | 0.585 | 0.649 | 0.553 |
| 10.09.2022 | 0.488 | 0.575 | 0.482 |
| 09.09.2022 | 0.473 | 0.525 | 0.442 |
| 08.09.2022 | 0.478 | 0.525 | 0.442 |
© Bayerisches Landesamt für Umwelt 2025