
- Start >
- Rivers >
- Discharge >
- Oberer Main - Elbe >
- Bad Berneck >
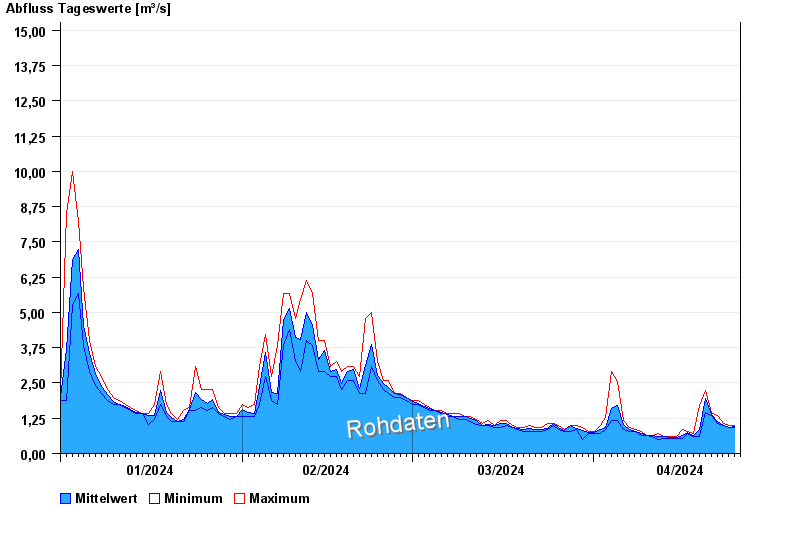
- Chart of year

Chart of year Bad Berneck / Weißer Main
Discharge from 01.01.2024 to 25.04.2024
- 28.05.2006 Abfluss: 42,2 m³/s
- 01.11.1998 Abfluss: 22,3 m³/s
- 10.03.1981 Abfluss: 21,5 m³/s
- 28.01.2002 Abfluss: 21,4 m³/s
- 29.06.1966 Abfluss: 21 m³/s
| Date | Mean value [m³/s] | Maximum [m³/s] | Minimum [m³/s] |
|---|---|---|---|
| 25.04.2024 | 0.91 | 0.91 | 0.91 |
| 24.04.2024 | 0.936 | 0.994 | 0.91 |
| 23.04.2024 | 1 | 1.08 | 0.994 |
| 22.04.2024 | 1.15 | 1.36 | 1.08 |
| 21.04.2024 | 1.39 | 1.47 | 1.36 |
| 20.04.2024 | 1.94 | 2.25 | 1.47 |
| 19.04.2024 | 0.843 | 1.7 | 0.592 |
© Bayerisches Landesamt für Umwelt 2024