
- Start >
- Rivers >
- Discharge >
- Oberer Main - Elbe >
- Bad Berneck >
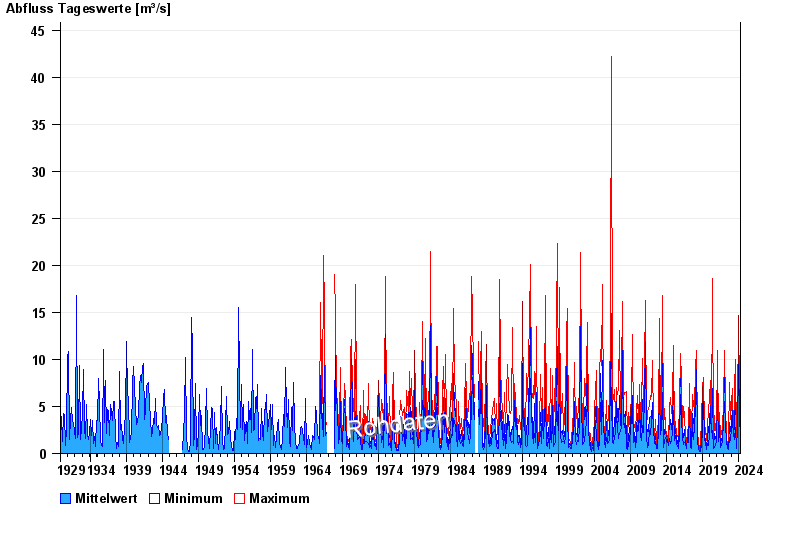
- Chart of total period

Chart of total period Bad Berneck / Weißer Main
Discharge from 01.11.1929 to 17.04.2024
| Date | Mean value [m³/s] | Maximum [m³/s] | Minimum [m³/s] |
|---|---|---|---|
| 17.04.2024 | 0.866 | 0.873 | 0.804 |
| 16.04.2024 | 0.726 | 0.949 | 0.62 |
| 15.04.2024 | 0.632 | 0.678 | 0.62 |
| 14.04.2024 | 0.653 | 0.678 | 0.62 |
| 13.04.2024 | 0.675 | 0.678 | 0.62 |
| 12.04.2024 | 0.681 | 0.804 | 0.565 |
| 11.04.2024 | 0.723 | 0.738 | 0.678 |
© Bayerisches Landesamt für Umwelt 2024