
- Start >
- Rivers >
- Discharge >
- Oberer Main - Elbe >
- Arzberg >
- Chart of total period

Chart of total period Arzberg / Röslau
Discharge from 01.11.1976 to 16.04.2024
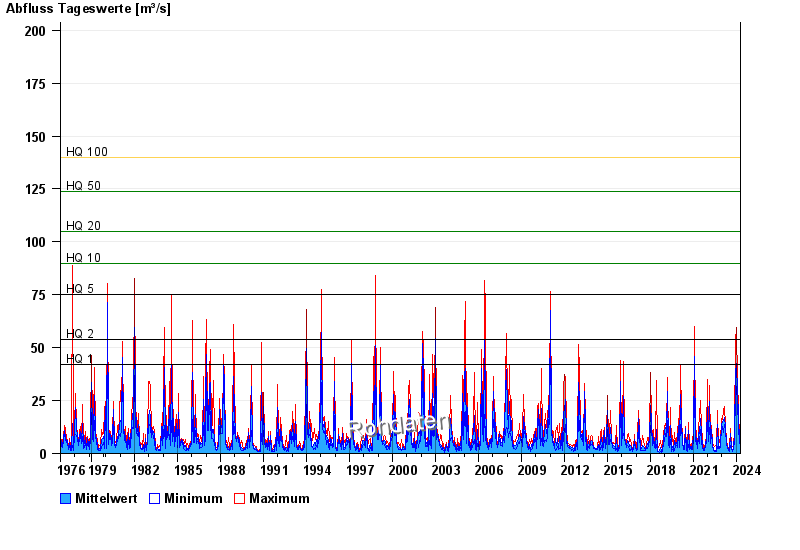
- HQ1 42 m³/s
- HQ2 54 m³/s
- HQ5 75 m³/s
- HQ10 90 m³/s
- HQ20 105 m³/s
- HQ50 124 m³/s
- HQ100 140 m³/s
| Date | Mean value [m³/s] | Maximum [m³/s] | Minimum [m³/s] |
|---|---|---|---|
| 16.04.2024 | 1.94 | 3.05 | 1.7 |
| 15.04.2024 | 1.66 | 1.7 | 1.59 |
| 14.04.2024 | 1.65 | 1.7 | 1.59 |
| 13.04.2024 | 1.72 | 1.81 | 1.59 |
| 12.04.2024 | 1.82 | 1.91 | 1.7 |
| 11.04.2024 | 1.88 | 1.91 | 1.81 |
| 10.04.2024 | 2.17 | 2.52 | 1.91 |
© Bayerisches Landesamt für Umwelt 2024