
- Start >
- Rivers >
- Discharge >
- Oberer Main - Elbe >
- Aeschach >
- Chart of year

Chart of year Aeschach / Oberreitnauer Ach
Discharge from 01.01.2024 to 24.04.2024
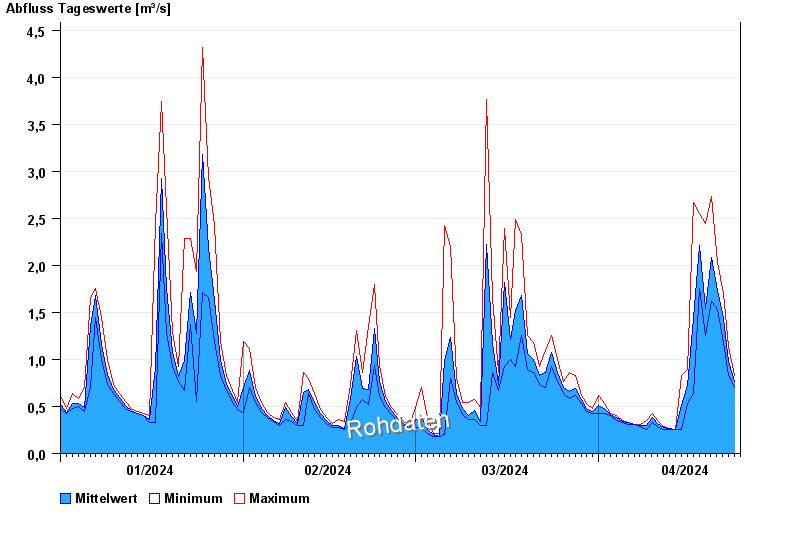
| Date | Mean value [m³/s] | Maximum [m³/s] | Minimum [m³/s] |
|---|---|---|---|
| 24.04.2024 | 0.785 | 0.827 | 0.733 |
| 23.04.2024 | 0.98 | 1.14 | 0.827 |
| 22.04.2024 | 1.43 | 1.7 | 1.18 |
| 21.04.2024 | 1.73 | 2.03 | 1.53 |
| 20.04.2024 | 2.08 | 2.73 | 1.62 |
| 19.04.2024 | 1.54 | 2.44 | 1.25 |
| 18.04.2024 | 2.21 | 2.55 | 1.75 |
© Bayerisches Landesamt für Umwelt 2024