

Chart of year Würzburg / Main
Discharge from 27.01.2023 to 26.01.2024
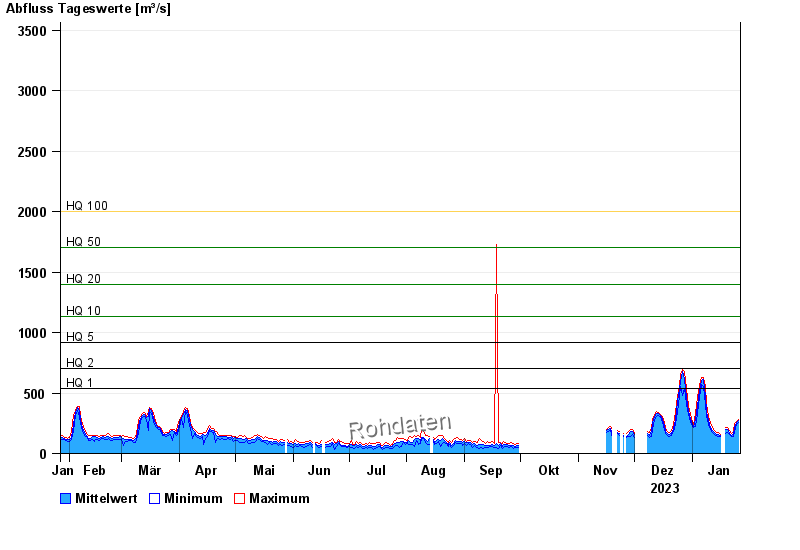
- HQ1 540 m³/s
- HQ2 700 m³/s
- HQ5 920 m³/s
- HQ10 1130 m³/s
- HQ20 1400 m³/s
- HQ50 1700 m³/s
- HQ100 2000 m³/s
| Date | Mean value [m³/s] | Maximum [m³/s] | Minimum [m³/s] |
|---|---|---|---|
| 26.01.2024 | 270 | 285 | 260 |
| 25.01.2024 | 254 | 267 | 240 |
| 24.01.2024 | 211 | 246 | 176 |
| 23.01.2024 | 153 | 178 | 139 |
| 22.01.2024 | 152 | 164 | 137 |
| 21.01.2024 | 169 | 189 | 158 |
| 20.01.2024 | 202 | 217 | 176 |
© Bayerisches Landesamt für Umwelt 2024