

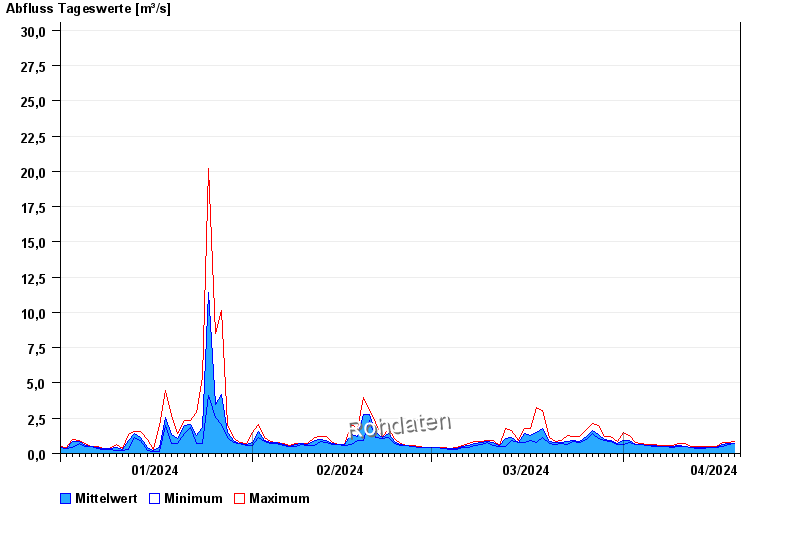
Chart of year Winkel / Starzlach
Discharge from 01.01.2024 to 19.04.2024
- 25.06.1955 Abfluss: 120 m³/s
- 21.05.1999 Abfluss: 88,8 m³/s
- 10.08.1970 Abfluss: 74 m³/s
- 23.08.2005 Abfluss: 57,6 m³/s
- 12.08.2002 Abfluss: 49,8 m³/s
| Date | Mean value [m³/s] | Maximum [m³/s] | Minimum [m³/s] |
|---|---|---|---|
| 19.04.2024 | 0.746 | 0.746 | 0.746 |
| 18.04.2024 | 0.674 | 0.746 | 0.618 |
| 17.04.2024 | 0.604 | 0.746 | 0.463 |
| 16.04.2024 | 0.45 | 0.463 | 0.417 |
| 15.04.2024 | 0.435 | 0.463 | 0.417 |
| 14.04.2024 | 0.414 | 0.463 | 0.372 |
| 13.04.2024 | 0.422 | 0.463 | 0.372 |
© Bayerisches Landesamt für Umwelt 2024