

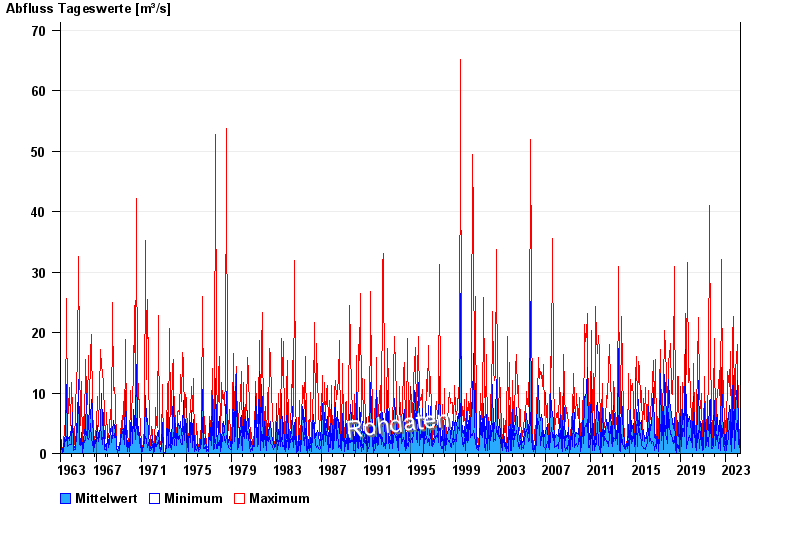
Chart of total period Wertach / Wertacher Starzlach
Discharge from 01.11.1963 to 19.04.2024
| Date | Mean value [m³/s] | Maximum [m³/s] | Minimum [m³/s] |
|---|---|---|---|
| 19.04.2024 | 0.531 | 0.574 | 0.49 |
| 18.04.2024 | 0.517 | 0.574 | 0.49 |
| 17.04.2024 | 0.473 | 0.574 | 0.346 |
| 16.04.2024 | 0.35 | 0.415 | 0.346 |
| 15.04.2024 | 0.361 | 0.415 | 0.284 |
| 14.04.2024 | 0.337 | 0.415 | 0.284 |
| 13.04.2024 | 0.318 | 0.415 | 0.284 |
© Bayerisches Landesamt für Umwelt 2024