

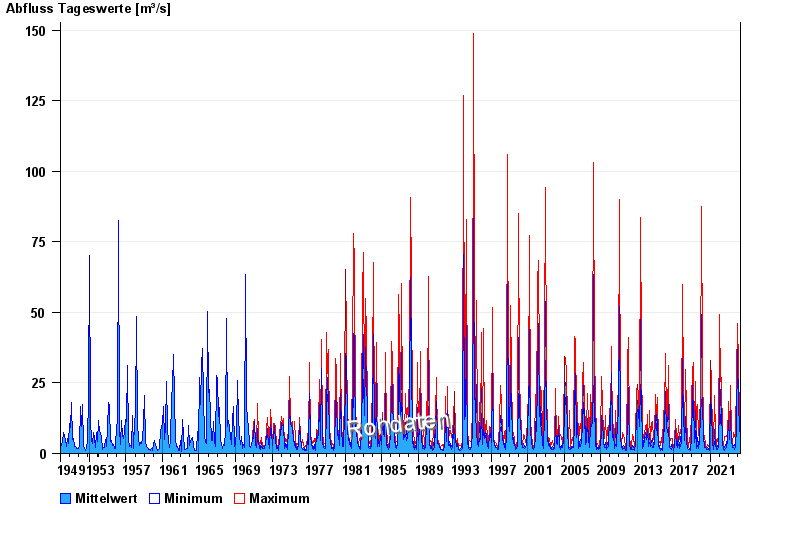
Chart of total period Weilbach / Mud
Discharge from 01.11.1949 to 24.04.2024
| Date | Mean value [m³/s] | Maximum [m³/s] | Minimum [m³/s] |
|---|---|---|---|
| 24.04.2024 | 4.17 | 4.5 | 4.01 |
| 23.04.2024 | 4.43 | 4.67 | 4.17 |
| 22.04.2024 | 5.23 | 6.19 | 4.67 |
| 21.04.2024 | 4.78 | 5.78 | 3.86 |
| 20.04.2024 | 4.71 | 7.47 | 3.86 |
| 19.04.2024 | 3.66 | 7.7 | 2.65 |
| 18.04.2024 | 2.78 | 2.89 | 2.65 |
© Bayerisches Landesamt für Umwelt 2024